
The Upstate housing market is offering buyers something that has been in shorter supply in recent years: choice. But more homes on the market does not necessarily mean a weakening market.
July data across Greater Greenville, Spartanburg, and the Western Upstate points to a market that is becoming more selective and increasingly nuanced. Inventory is expanding, homes are generally taking longer to secure a buyer than they did a year ago, and price trends vary considerably from one market and price point to another. At the same time, sales activity remains resilient in key areas, with notable strength continuing at the upper end of the market.
The result is a market that increasingly rewards strategy over assumption.
More Choice is Reshaping the Market
Perhaps the clearest theme in July is the continued expansion of available inventory.
Greater Greenville ended the month with 6,448 homes for sale, up 9.3% from July 2025. Spartanburg inventory reached 2,477 homes, an increase of 6.3%. The shift was most pronounced in the Western Upstate, where 2,993 homes were available, 33.7% more than one year earlier.
The month-over-month movement adds another layer. Compared with June, inventory was nearly unchanged in Greater Greenville at +0.7% and Spartanburg at −0.6%, while the Western Upstate added inventory much more quickly at +7.5%.
That distinction matters. The Upstate is not experiencing one uniform shift. Greater Greenville and Spartanburg appear to be settling into higher inventory levels, while supply continues to build more rapidly across the Western Upstate.
For buyers, additional inventory can mean more opportunities to compare properties and make considered decisions. For sellers, it means a listing is increasingly competing for attention rather than simply benefiting from limited supply.
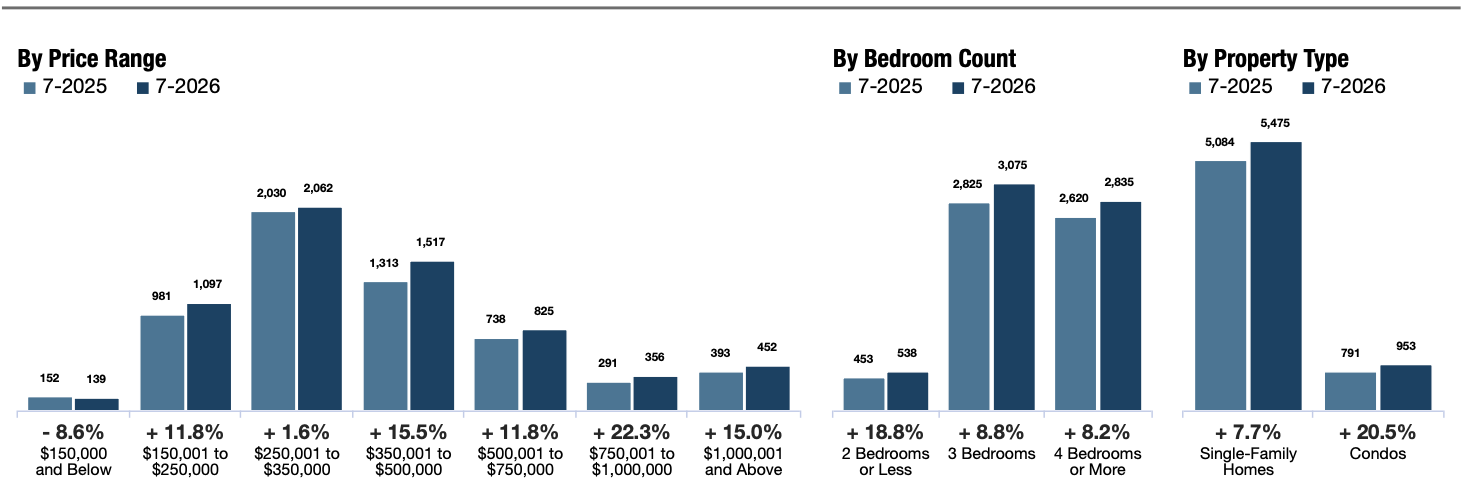
Inventory of Homes for Sale, GGAR MLS
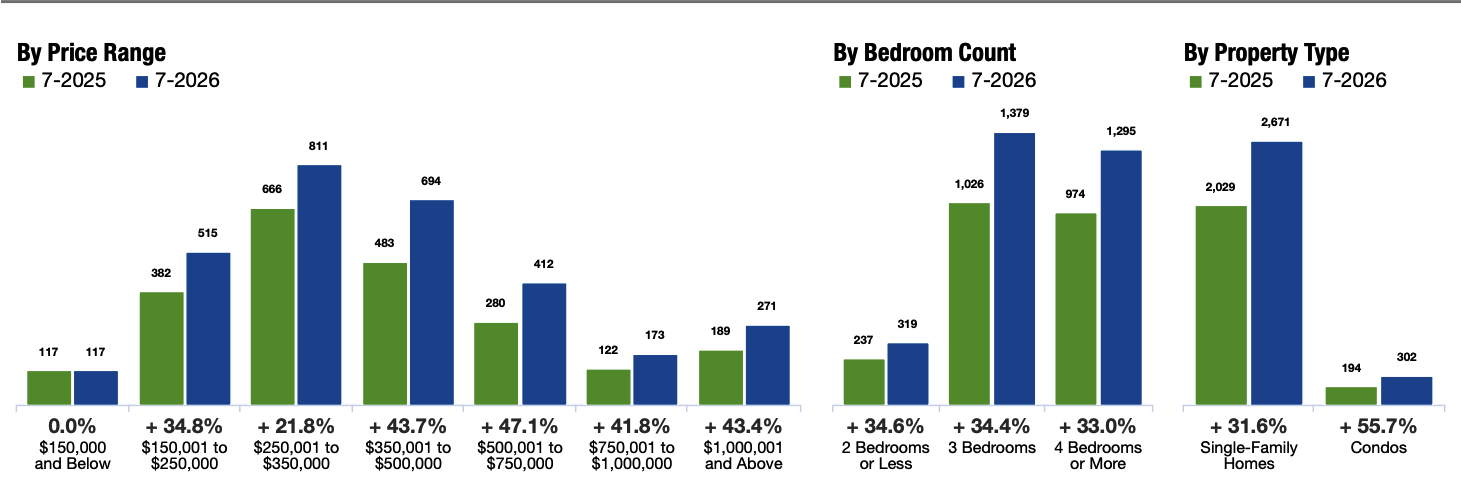
Inventory of Homes for Sale, Western Upstate MLS
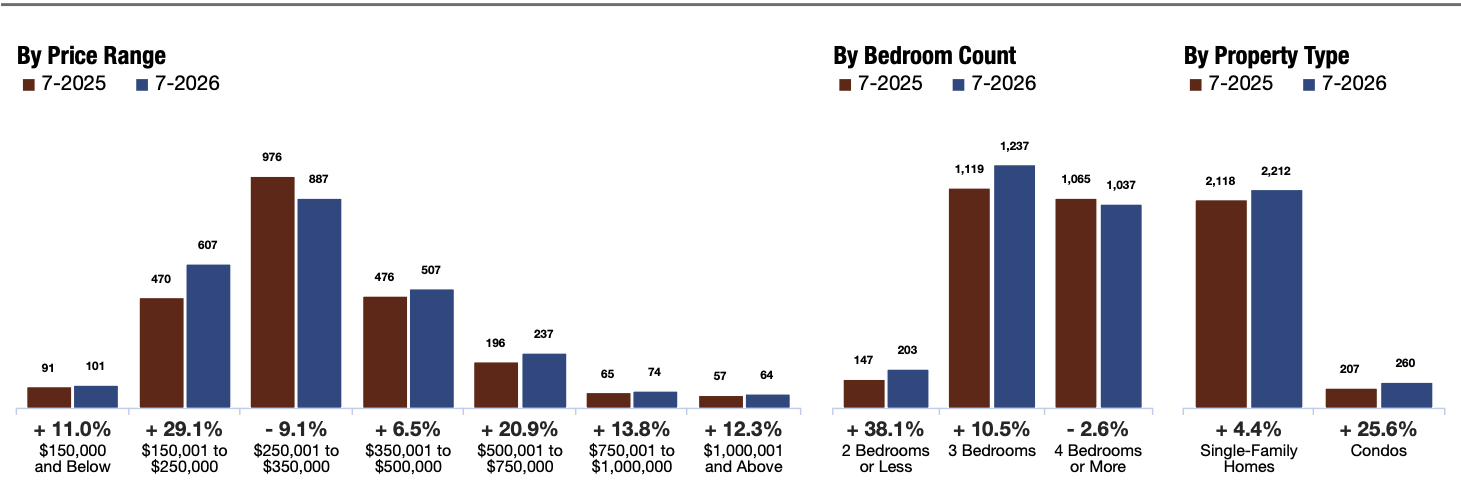
Inventory of Homes for Sale, SAR MLS
More Inventory Has Not Meant Less Activity
Rising inventory is only one side of the story.
Greater Greenville recorded 1,713 closed sales in July, 4.5% more than July 2025. Pending sales also increased 0.6% year over year, while year-to-date closed sales were up 4.7%.
Spartanburg followed a similar pattern for the month. 635 homes closed in July, a 1.3% increase from a year earlier, while pending sales rose 4.5%. Year-to-date closed sales, however, remained 0.7% below the same period in 2025.
The Western Upstate tells a different story. July closed sales totaled 589, down 2.0% year over year, and pending sales were softer. The broader rolling 12-month measure shows pending sales down 0.4% from the previous 12-month period.
Taken together, these figures reinforce an important distinction: more inventory is not automatically translating into falling demand across the Upstate. In Greater Greenville and Spartanburg, buyer activity has remained comparatively resilient even as selection has expanded. In the Western Upstate, supply growth has been more substantial and demand indicators are more mixed.
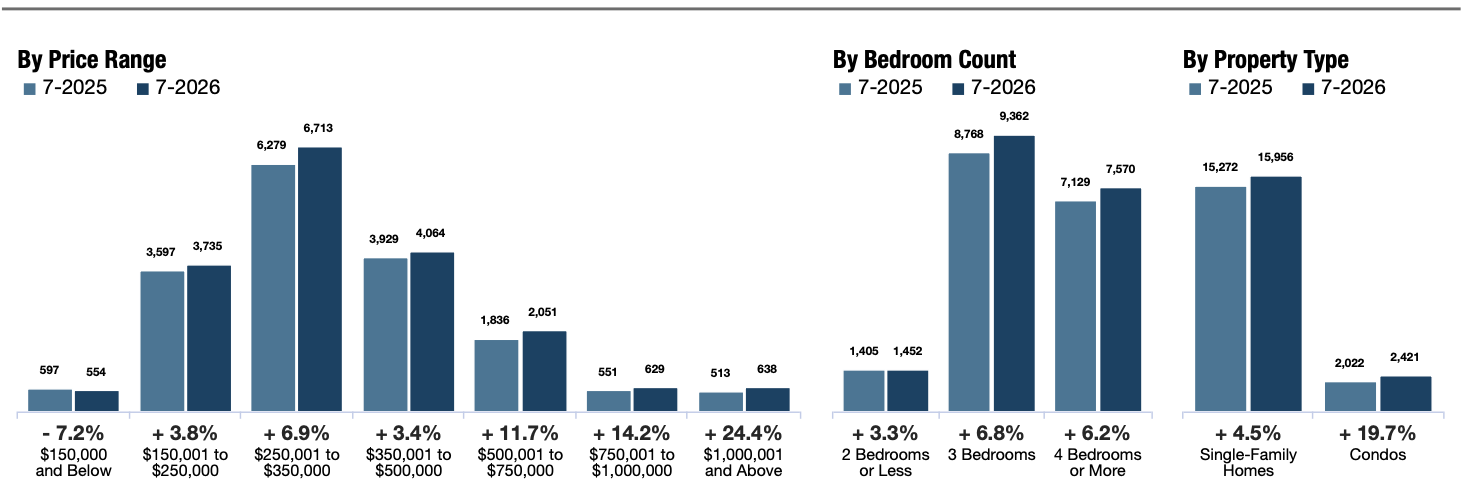
Closed Sales, GGAR MLS
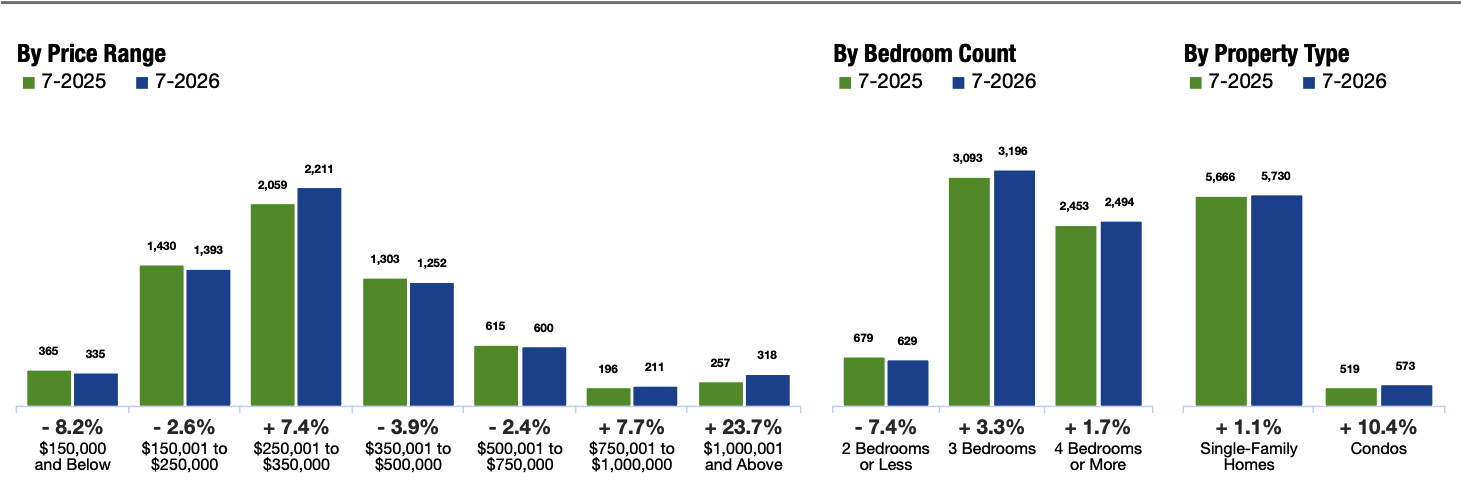
Closed Sales, WUMLS
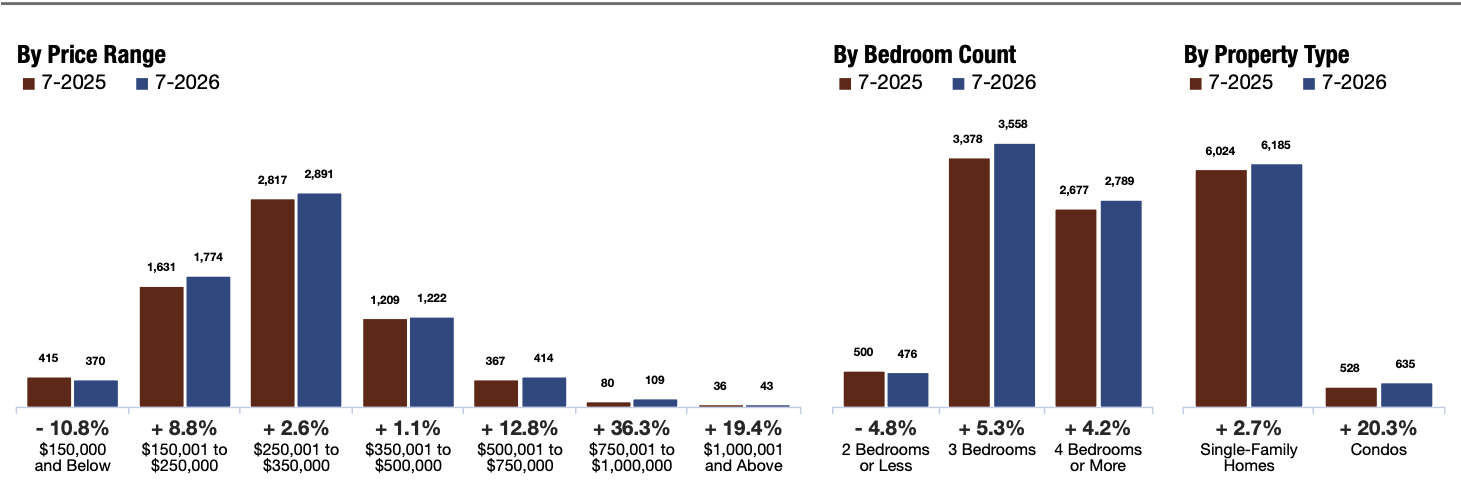
Closed Sales, SAR MLS
Buyers Have More Time, but the Shift is Relative
Homes are generally taking longer to move than they were a year ago.
In Greater Greenville, average days on market reached 53 days in July, compared with 48 days a year earlier, a 10.4% increase. Spartanburg reached 55 days, compared with 42 in July 2025, a 31.0% increase. The Western Upstate averaged 73 days, 14.1% higher year over year.
Month over month, however, the picture is different. Greater Greenville was essentially unchanged, moving from 52 to 53 days. Spartanburg improved from 61 to 55 days, while the Western Upstate moved from 79 to 73.
This is why a single monthly comparison can tell only part of the story. July was faster than June in two of the three markets, but the broader trend still shows homes generally requiring more time to secure a buyer than they did a year ago.
For sellers, that places greater importance on positioning a property correctly from the beginning. Pricing, presentation, condition, and marketing become increasingly consequential as buyers gain alternatives.
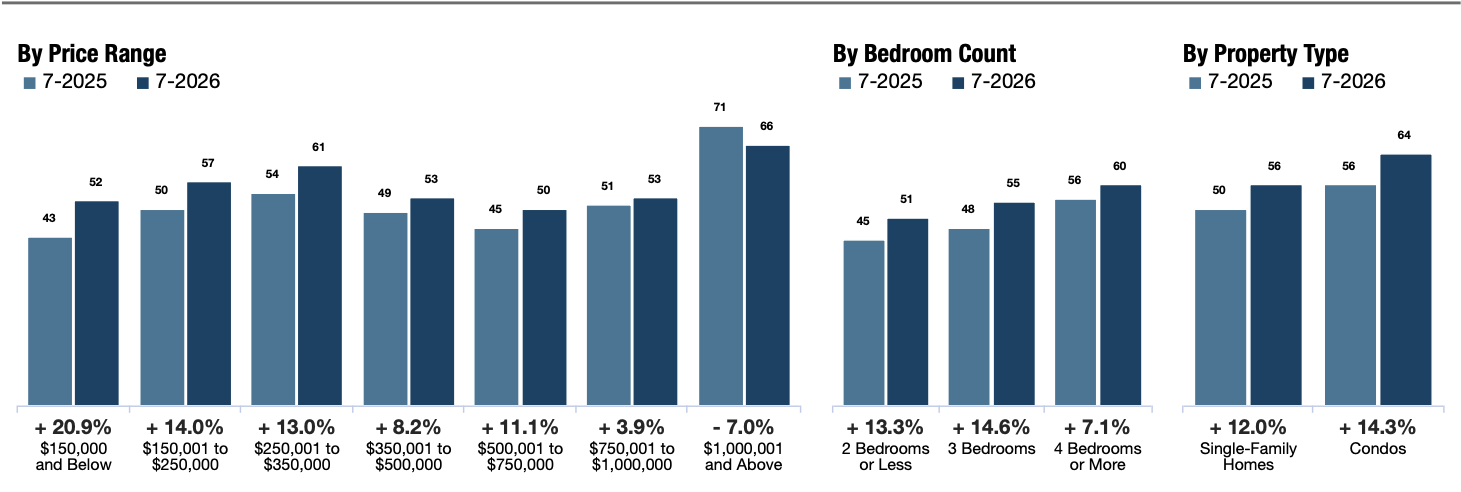
Days on Market Until Sale, GGAR MLS
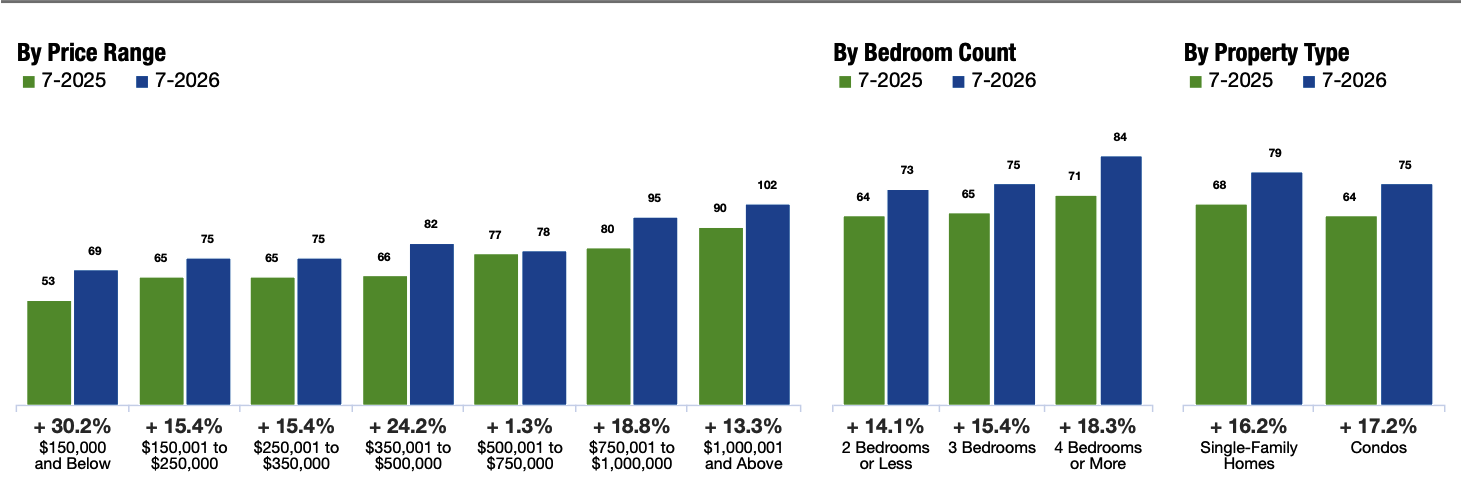
Days on Market Until Sale, WUMLS
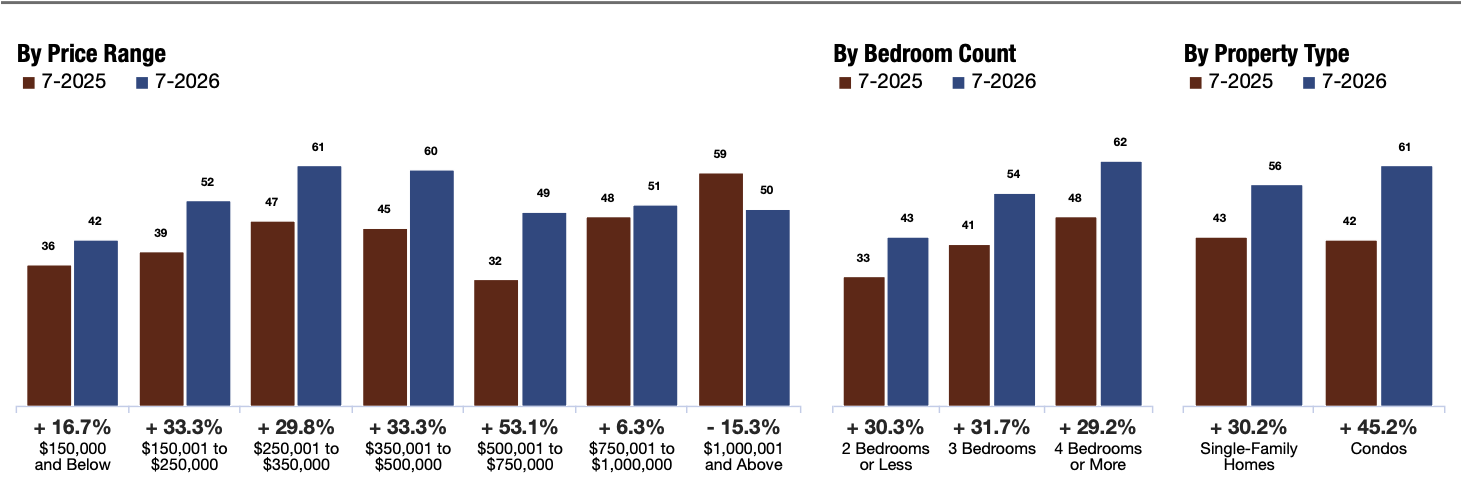
Days on Market Until Sale, SAR MLS
Prices Are Holding, but the Story Depends on the Market
Despite greater inventory and longer marketing times, there is little evidence in July's broader data of a sweeping decline in Upstate home values.
In Greater Greenville, the July median sales price was $326,000, down 1.7% from July 2025. Yet the rolling 12-month median reached $320,000, up 0.9%, while the year-to-date median remained unchanged at $320,000. Average sales price in July was $409,997, 2.2% above the prior year.
Spartanburg's July median was $289,000, down 2.8% year over year, while its rolling 12-month median remained flat at $290,000. The July average sales price of $318,793 was essentially unchanged from a year earlier.
The Western Upstate's rolling 12-month median was also unchanged at $310,000, even as inventory expanded substantially.
That combination is notable. Buyers have more options, but increased choice has not translated into broad-based price erosion. Instead, the market appears to be differentiating more sharply between properties, locations, and price points.
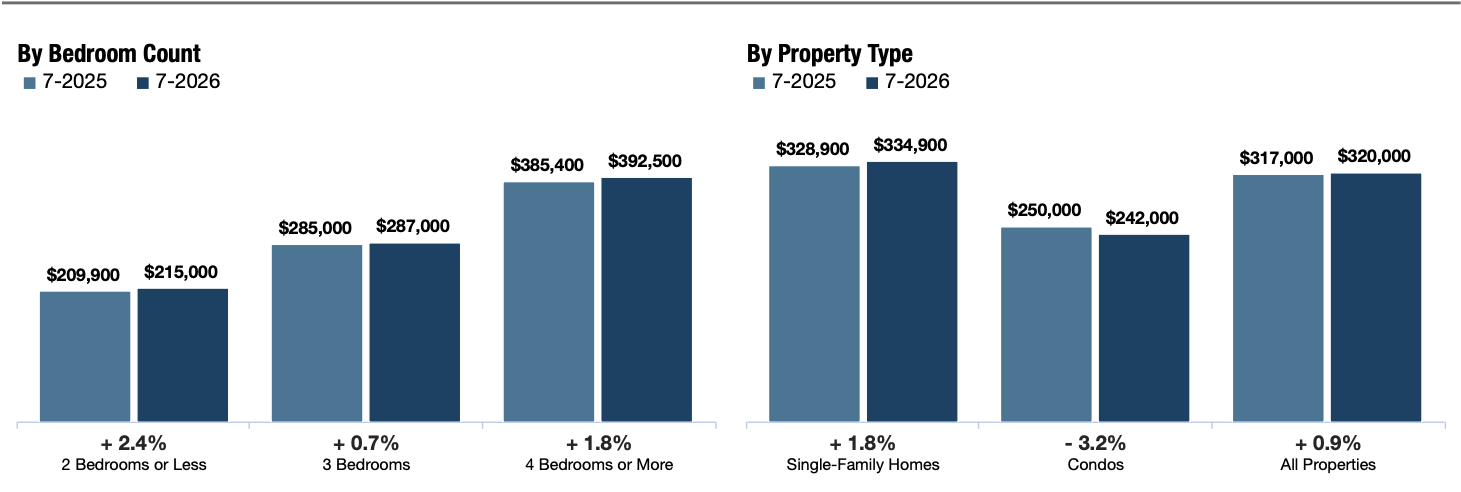
Median Sales Price, GGAR MLS
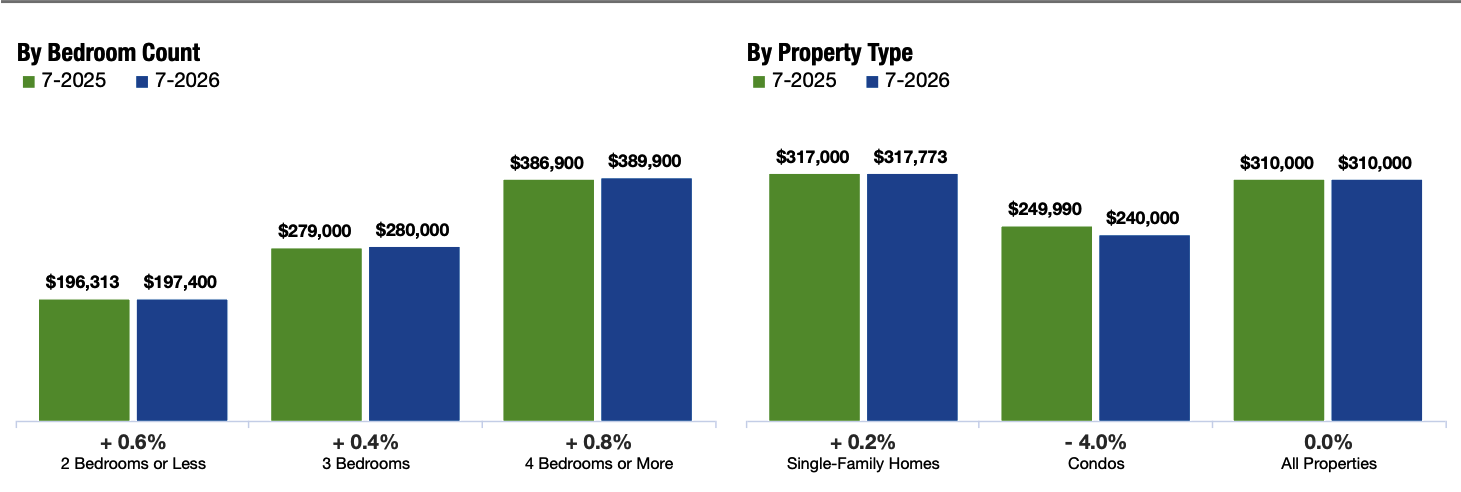
Median Sales Price, WUMLS
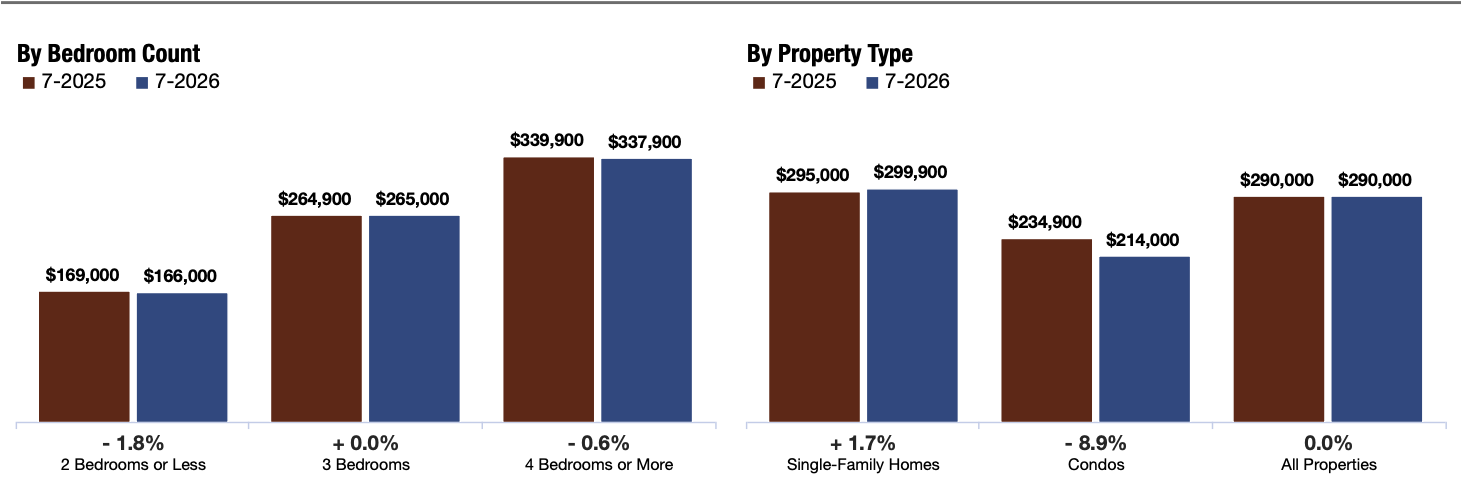
Median Sales Price, SAR MLS
The Upper End Continues to Stand Out
One of the more interesting patterns is occurring above $1 million.
Across all three MLS regions, the $1,000,001 and above category posted the strongest increase in rolling 12-month pending sales among the price ranges tracked in the housing supply reports.
In Greater Greenville, pending sales above $1 million increased 30.6%. Spartanburg recorded a 17.9% increase, while the Western Upstate posted a 9.4% gain.
The Western Upstate provides an especially useful example of why the market cannot be viewed through a single headline number. Overall rolling 12-month pending sales declined 0.4%, yet pending sales above $1 million increased 9.4%. Closed sales above $1 million were even stronger, rising 23.7% over the comparable 12-month period.
At the same time, upper-end homes generally require patience. In the Western Upstate, properties above $1 million averaged 102 days on market on a rolling 12-month basis, while Greater Greenville's same price category averaged 66 days.
Strong activity at the upper end, therefore, should not be confused with an indiscriminate seller's market. Luxury buyers remain active, but they also have options and can be highly selective.
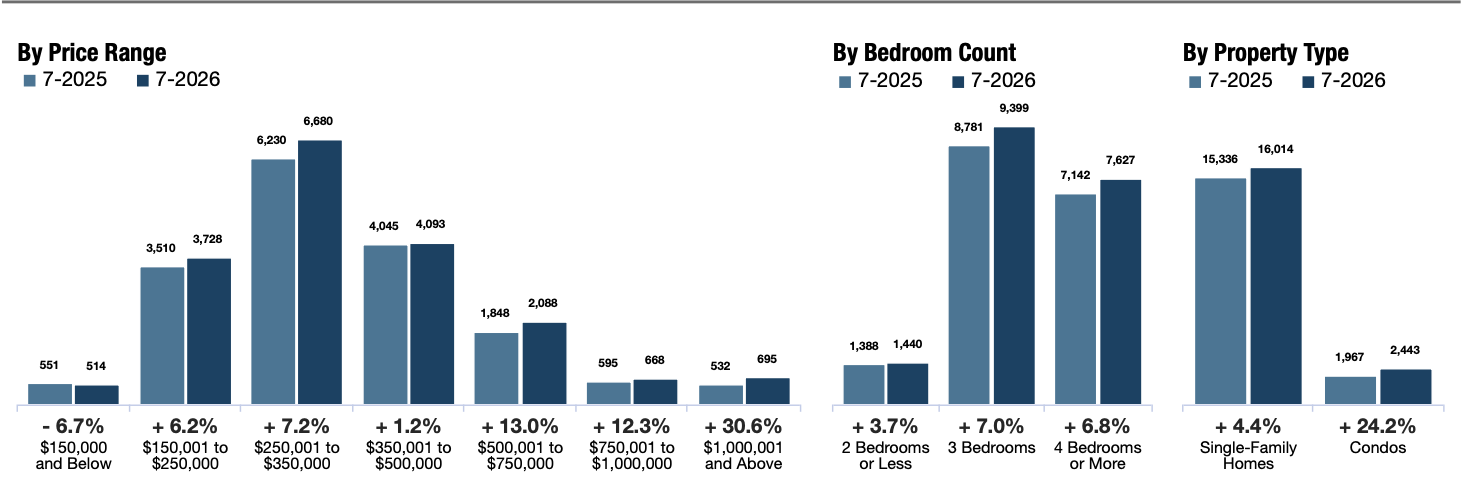
Pending Sales, GGAR MLS
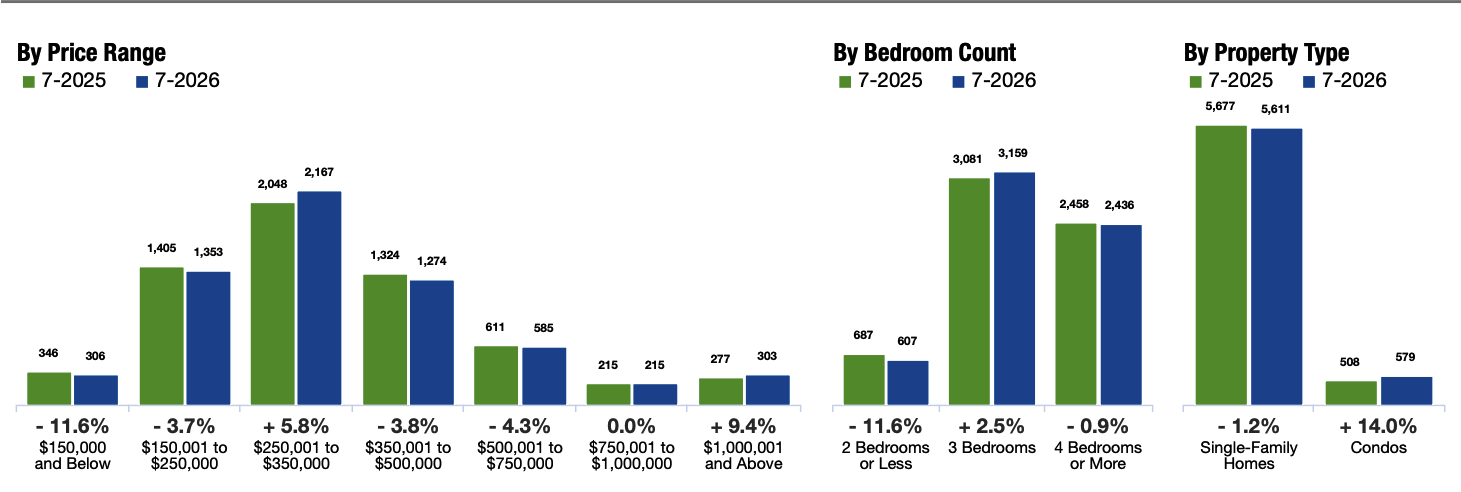
Pending Sales, WUMLS
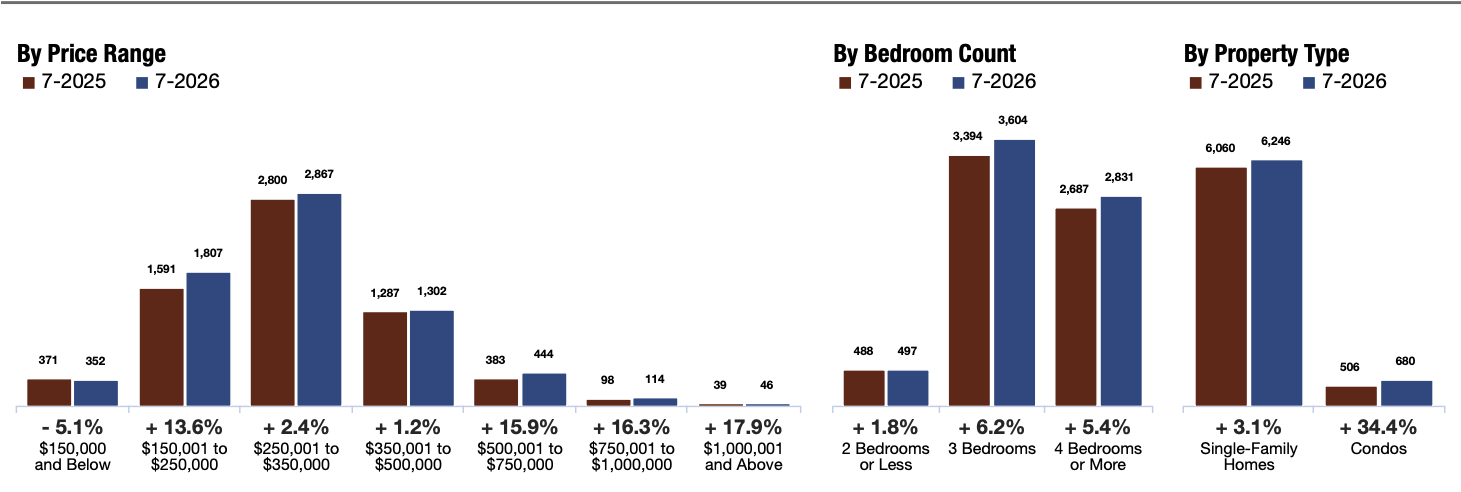
Pending Sales, SAR MLS
Where the Market is Diverging
Looking beneath the regional averages reveals even greater variation.
Within the Spartanburg Association of REALTORS® market, the city of Spartanburg recorded 138 closed sales in July, up 6.2% year over year, while inventory increased 41.4% to 642 homes. Its July median sales price increased 3.8% to $261,160.
Greer, within the SAR report, moved differently. July closed sales declined 11.8% year over year, inventory increased 5.9%, and days on market rose from 33 to 59.
And in the Western Upstate, some of the region's lifestyle and lake markets show just how much individual submarkets can depart from the overall averages. Lake Keowee inventory increased 63.4% year over year in July, while closed sales increased 6.5%. Its July median sales price was $1.2 million, although monthly price changes in smaller, higher-value markets should be interpreted cautiously because the mix of homes sold can materially affect the result.
The lesson is increasingly clear: there is no single Upstate market. Conditions can change materially by location, property type, and price range, making hyperlocal information increasingly valuable to both buyers and sellers.
What This Means for Buyers and Sellers
For buyers, the shift toward greater inventory creates opportunity. More selection and longer marketing times can provide additional room to evaluate properties carefully, particularly in segments where supply has expanded fastest. But desirable properties are still selling, and the continued activity at higher price points reinforces that well-positioned homes can attract demand even in a more selective environment.
For sellers, the market increasingly favors precision. Higher inventory means buyers can make more direct comparisons between competing homes. A pricing strategy based primarily on what neighboring properties achieved in a tighter market may not reflect today's competitive landscape. Presentation, positioning, exposure, and an understanding of the property's specific submarket all matter.
And for both sides of a transaction, the headline numbers are only a starting point. A market in which inventory rises while prices remain relatively stable is fundamentally different from one in which supply rises because demand has disappeared. July's data suggests the Upstate is much closer to the former.
Looking Ahead
The months ahead will help determine whether the Upstate's expanding inventory represents a lasting move toward greater balance or simply a normalization after several years of unusually constrained supply.
For now, three signals deserve particular attention: whether inventory continues to build into the fall, whether longer marketing times begin to place more pressure on pricing, and whether the strength seen in certain price segments continues even as the overall market becomes more competitive.
July offers an important reminder that a changing market is not necessarily a declining one. Across the Upstate, buyers have more choices, sellers face more competition, and outcomes are becoming increasingly dependent on the specifics of the property and the market in which it competes.
That makes understanding the numbers behind the headline more important than ever.
Data Sources & Methodology
This report incorporates July 2026 market data from the Greater Greenville Association of REALTORS® Multiple Listing Service, Spartanburg Association of REALTORS® Multiple Listing Service, and Western Upstate Association of REALTORS® Multiple Listing Service, as reported through South Carolina REALTORS®. Reports are current as of August 10, 2026.
Monthly figures represent activity for July 2026 unless otherwise noted. Year-over-year comparisons compare July 2026 with July 2025. Month-over-month comparisons compare July 2026 with June 2026. Year-to-date figures reflect activity through July of the respective year. Rolling 12-month statistics cover August 2025 through July 2026 and, where a percentage change is shown, compare that period with the preceding comparable 12-month period. The source reports note that percentage changes are calculated using rounded figures and that sales price and percent-of-list-price metrics do not account for seller concessions.
Source: Greater Greenville Association of REALTORS® MLS, Spartanburg Association of REALTORS® MLS, and Western Upstate Association of REALTORS® MLS. Provided by South Carolina REALTORS®. Report data © 2026 ShowingTime Plus, LLC.
Market statistics are provided for informational purposes and reflect the reporting periods and geographic areas identified. Real estate conditions vary by location, property type, price point, and other factors.
More from Blackstream