
The Upstate housing market continued to shift in August, but increasingly, there is no single trend that describes the region as a whole.
Across Greater Greenville, Spartanburg, and the Western Upstate, buyers generally have more choices than they did a year ago, and homes are taking longer to sell. At the same time, sales activity, pricing, and the pace at which new inventory is being absorbed vary considerably from one market to another.
Greater Greenville continues to show relatively steady demand despite higher inventory. Spartanburg is moving at a slower pace, while the Western Upstate is experiencing a much more pronounced increase in available supply alongside softer sales activity.
Rather than pointing to broad strength or weakness, August's numbers reflect a market that has become increasingly dependent on location, price point, and property positioning.
More Inventory, but Not the Same Market Everywhere
Inventory remains one of the clearest changes in the Upstate market.
Greater Greenville ended August with 6,512 homes for sale, an 8.5% increase from a year earlier. Spartanburg inventory rose more modestly, increasing 3.6% to 2,494 homes. The Western Upstate experienced a much larger shift, with inventory climbing 34.1% year over year to 3,022 homes.
The difference matters. More inventory generally gives buyers greater choice and reduces some of the urgency that characterized the market when supply was significantly tighter. But an 8.5% increase in Greater Greenville and a 34.1% increase in the Western Upstate are fundamentally different market conditions.
Months supply reinforces that distinction. Greater Greenville finished August at 4.2 months of inventory, Spartanburg at 4.4 months, and the Western Upstate at 5.9 months.
For buyers, that means opportunity is expanding, particularly in markets where supply has accumulated more quickly. For sellers, it means competition is no longer limited to simply getting a home on the market. Pricing, condition, presentation, and positioning relative to competing properties have become increasingly important.
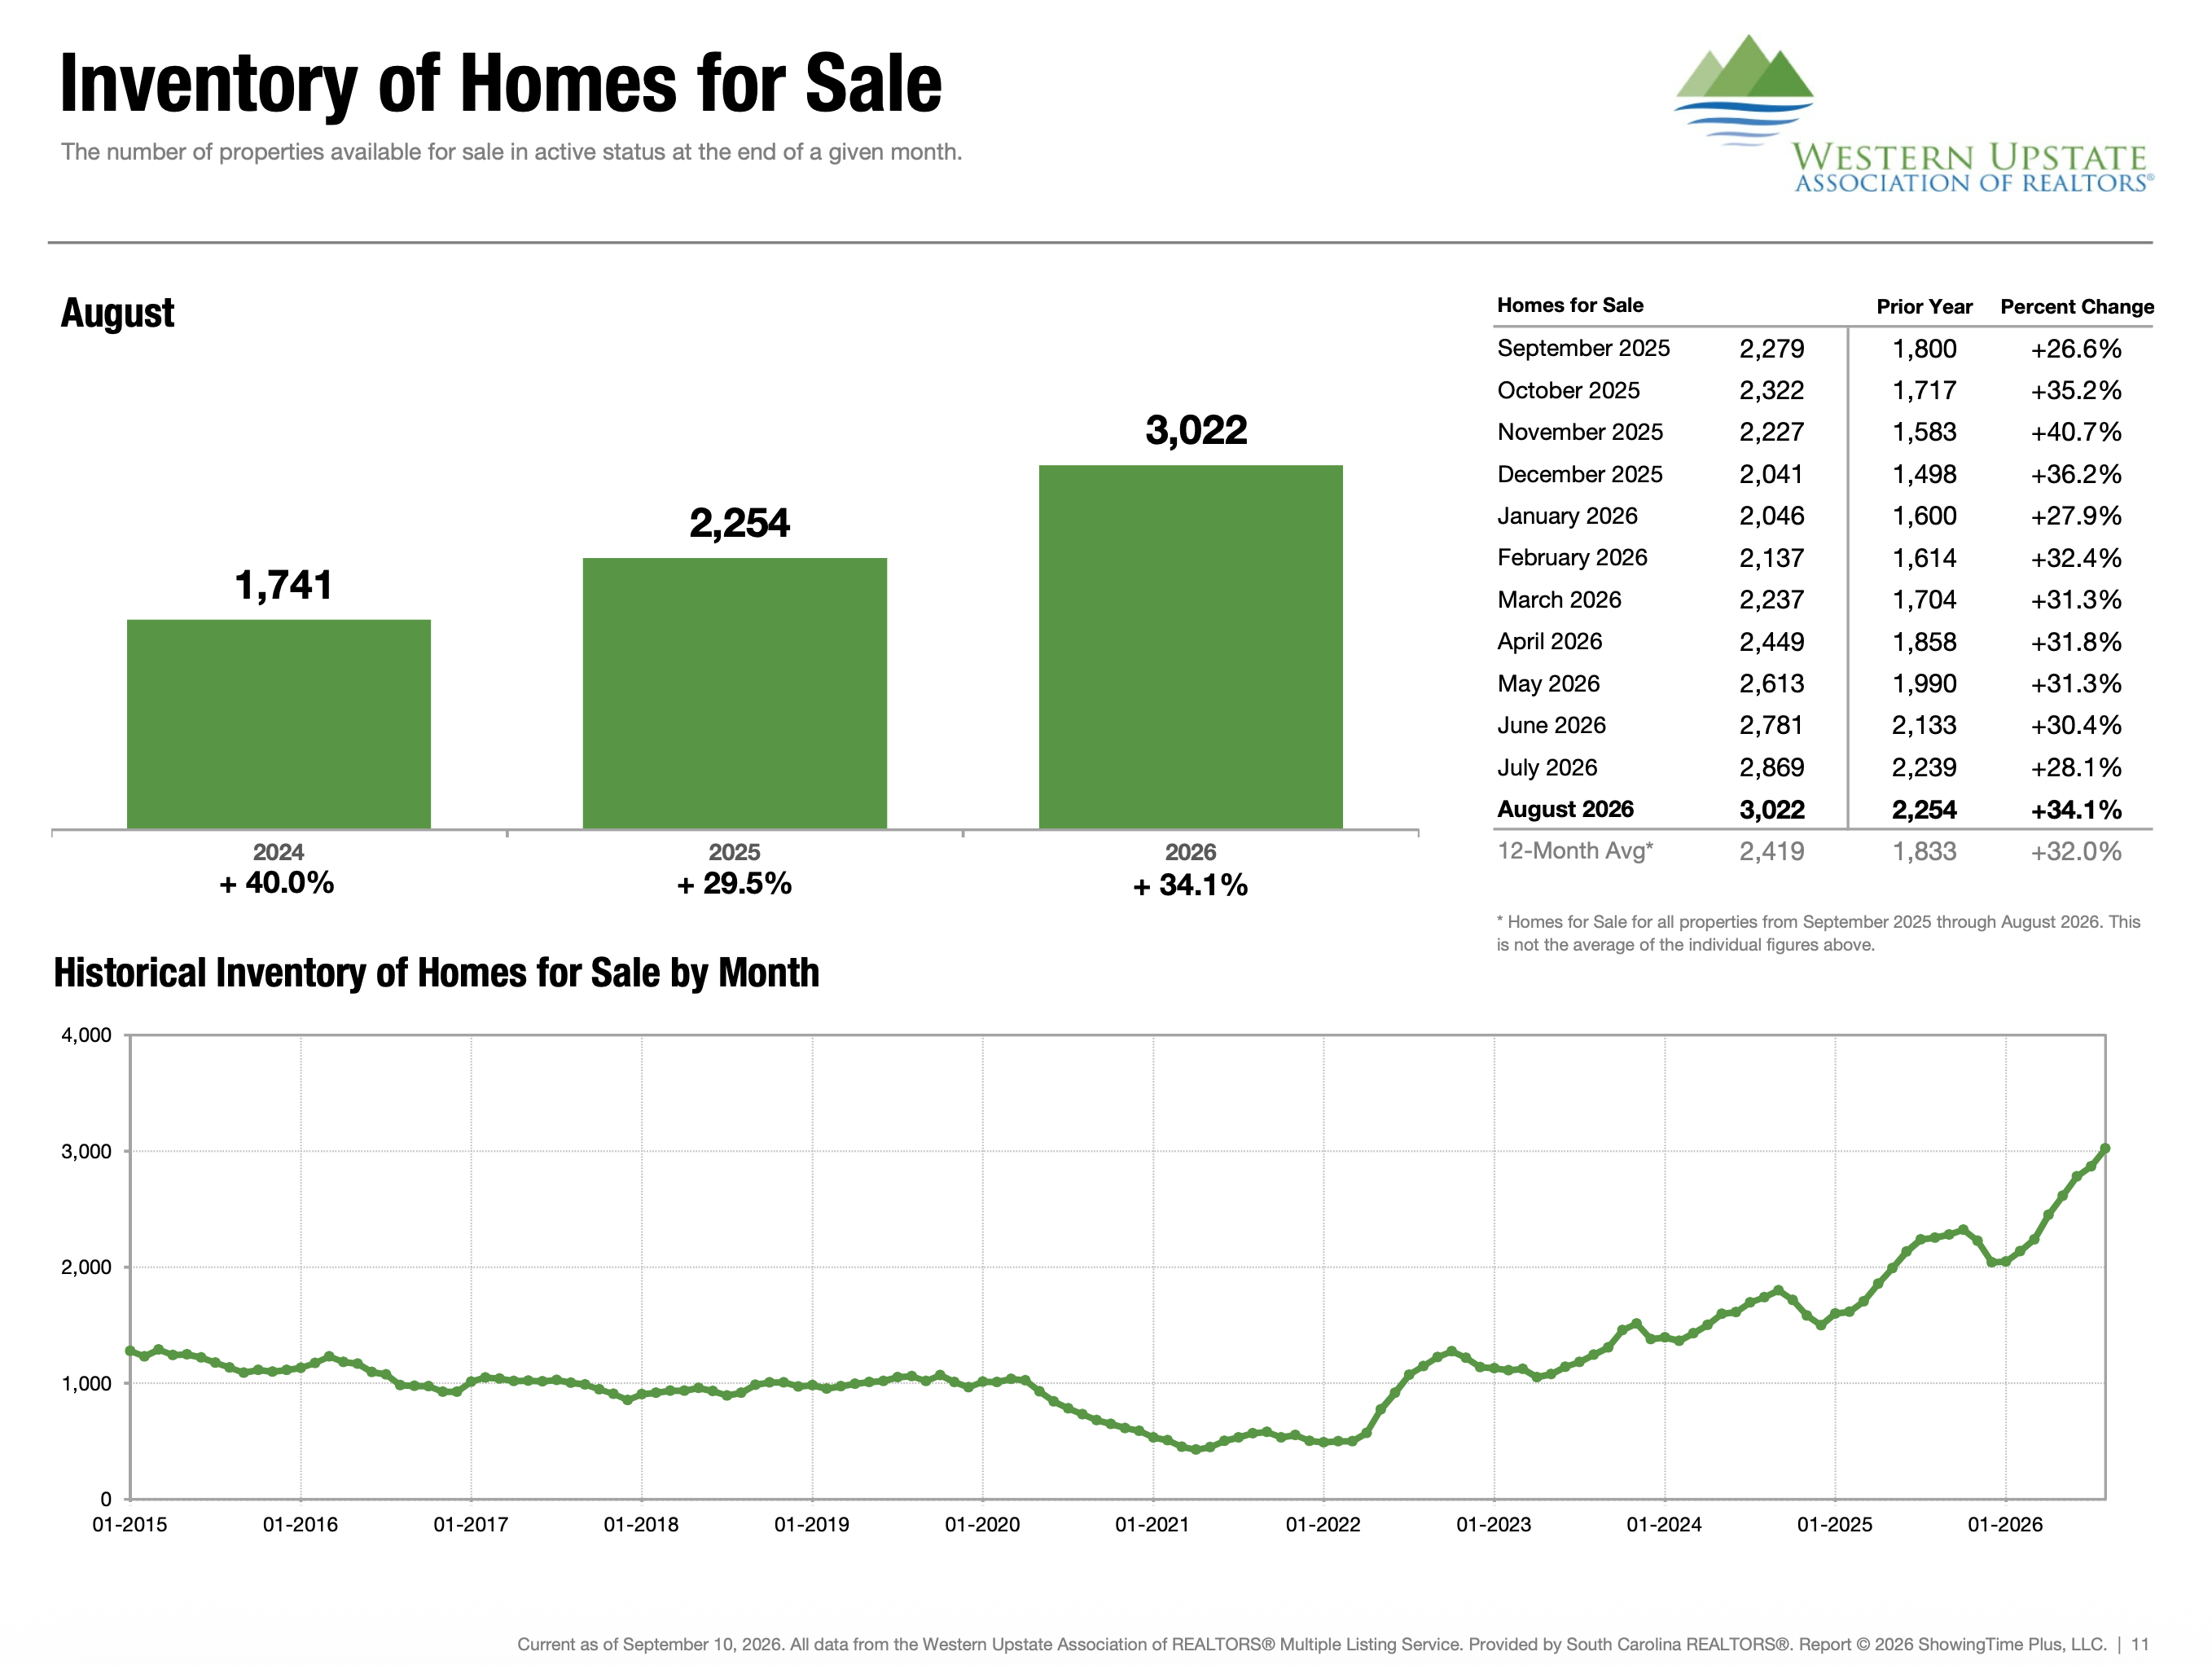
Inventory of Homes for Sale, WUMLS
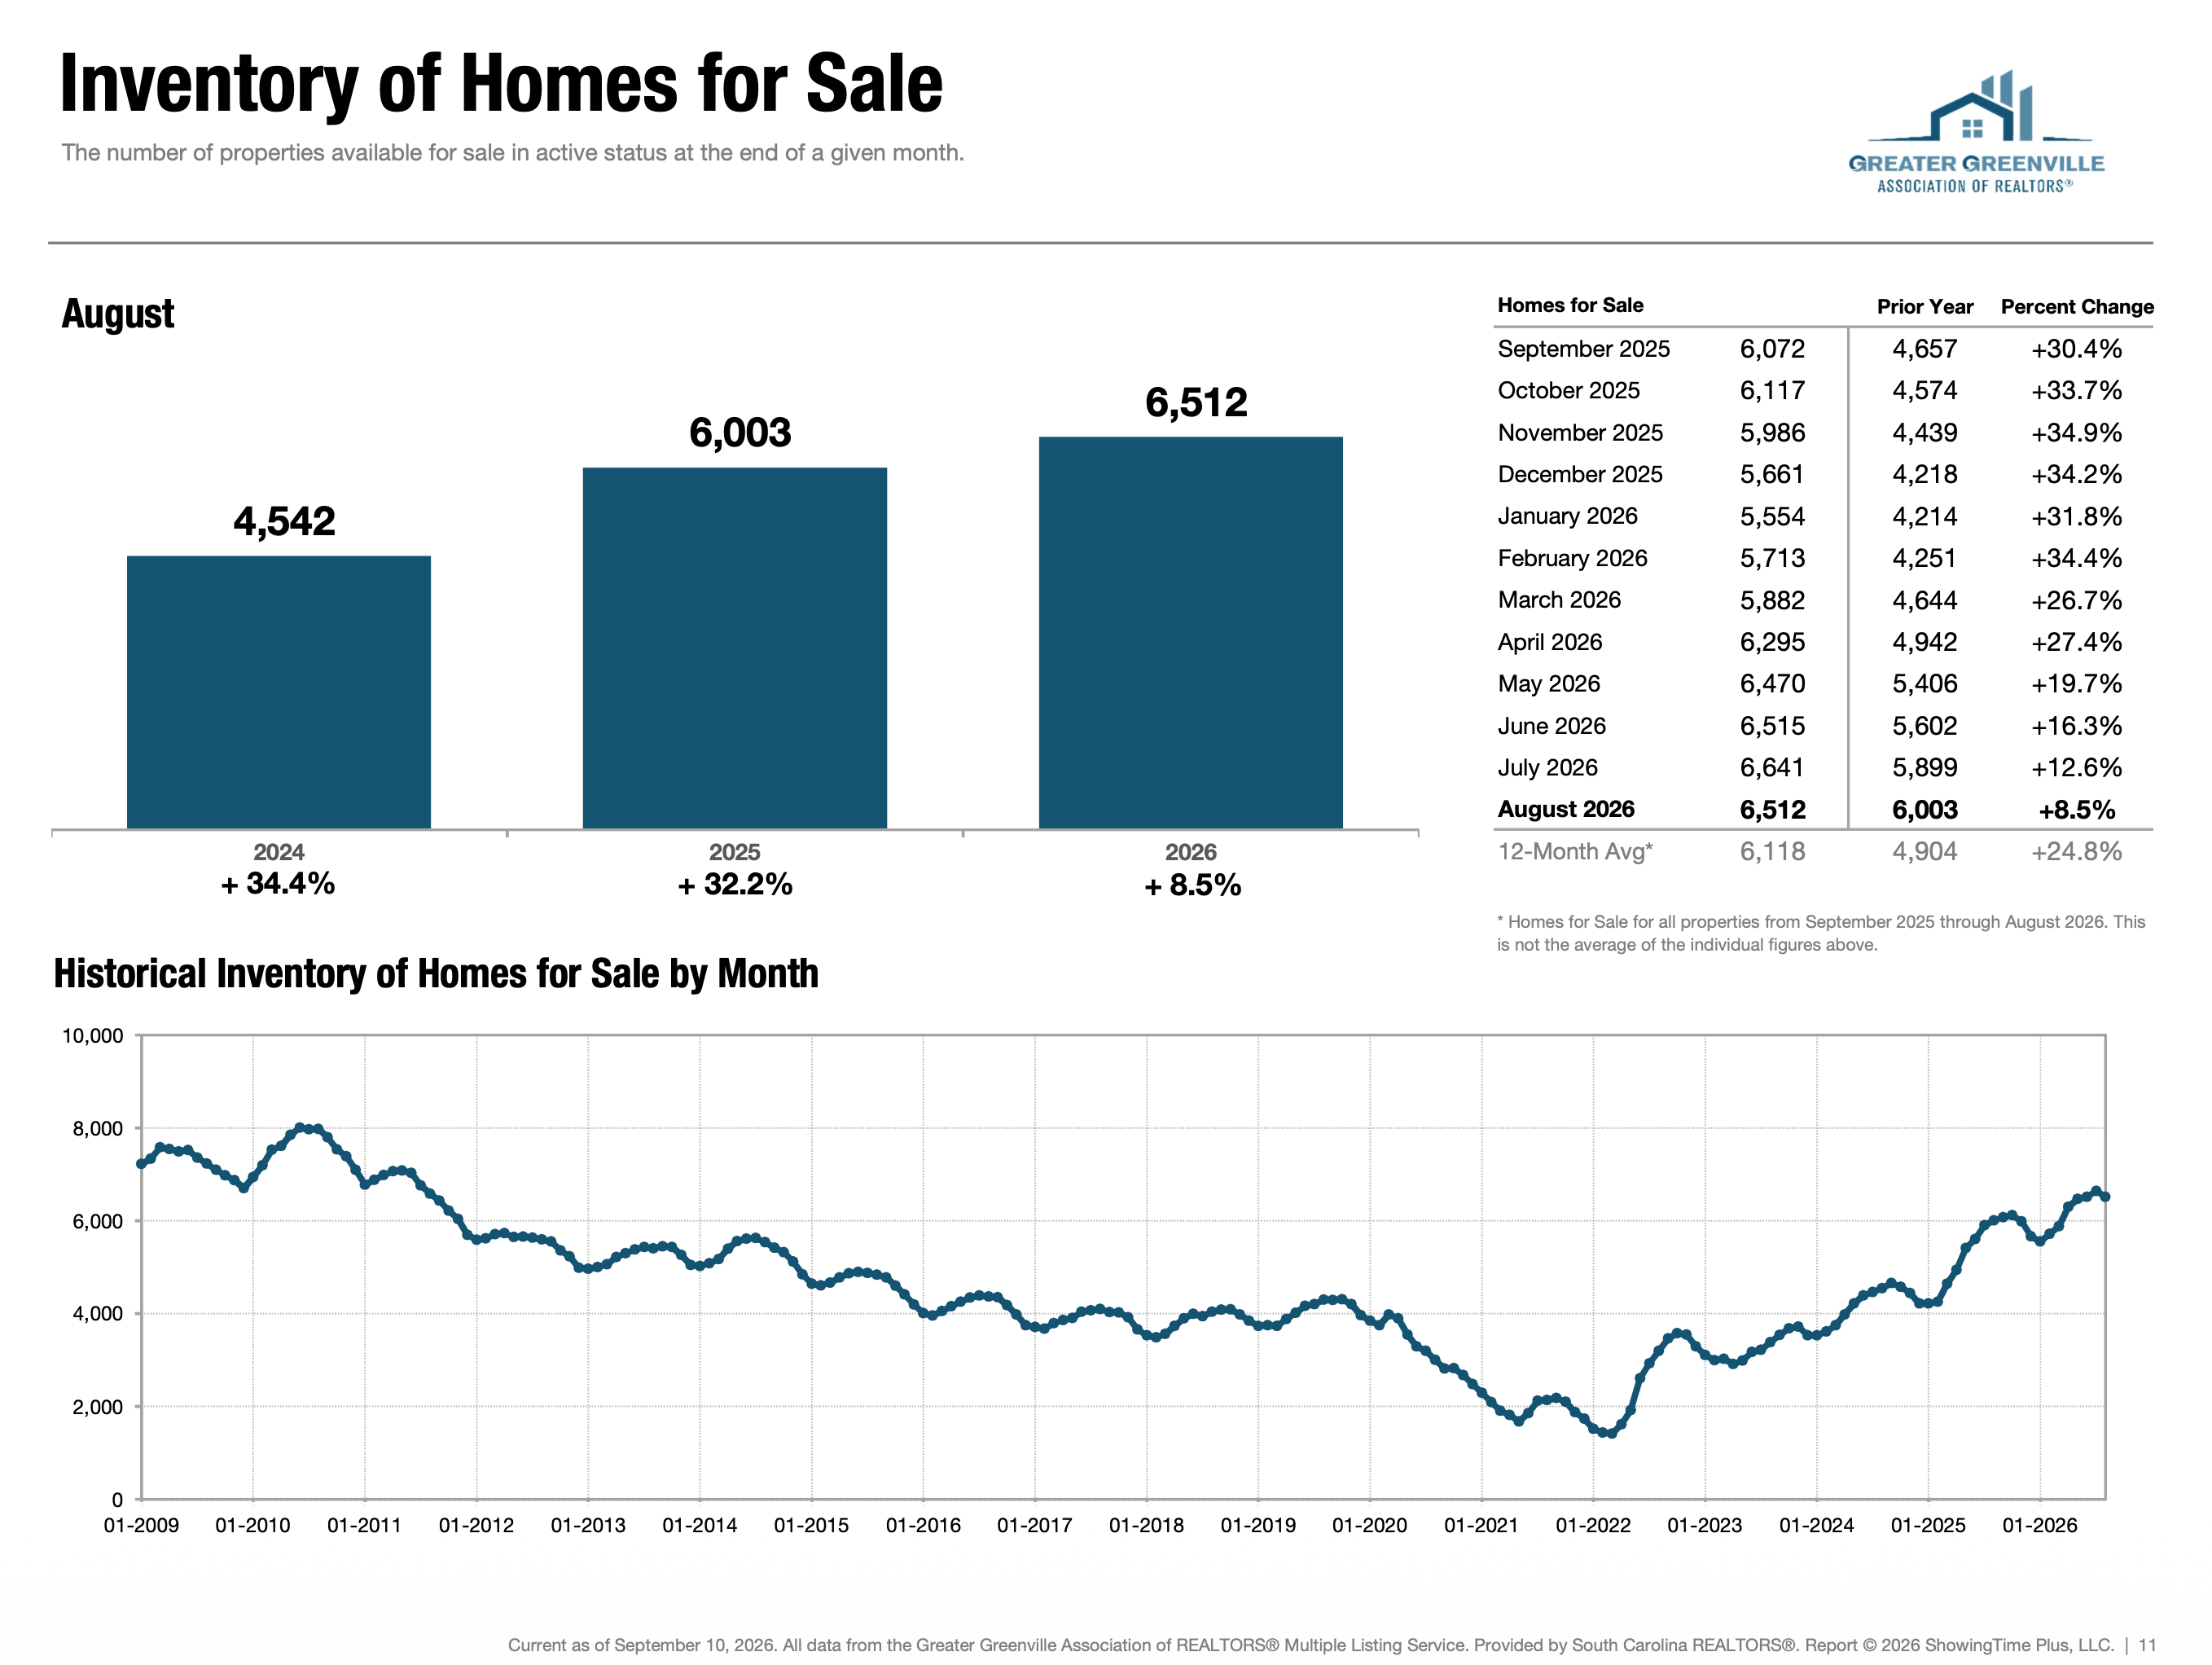
Inventory of Homes for Sale, GGAR
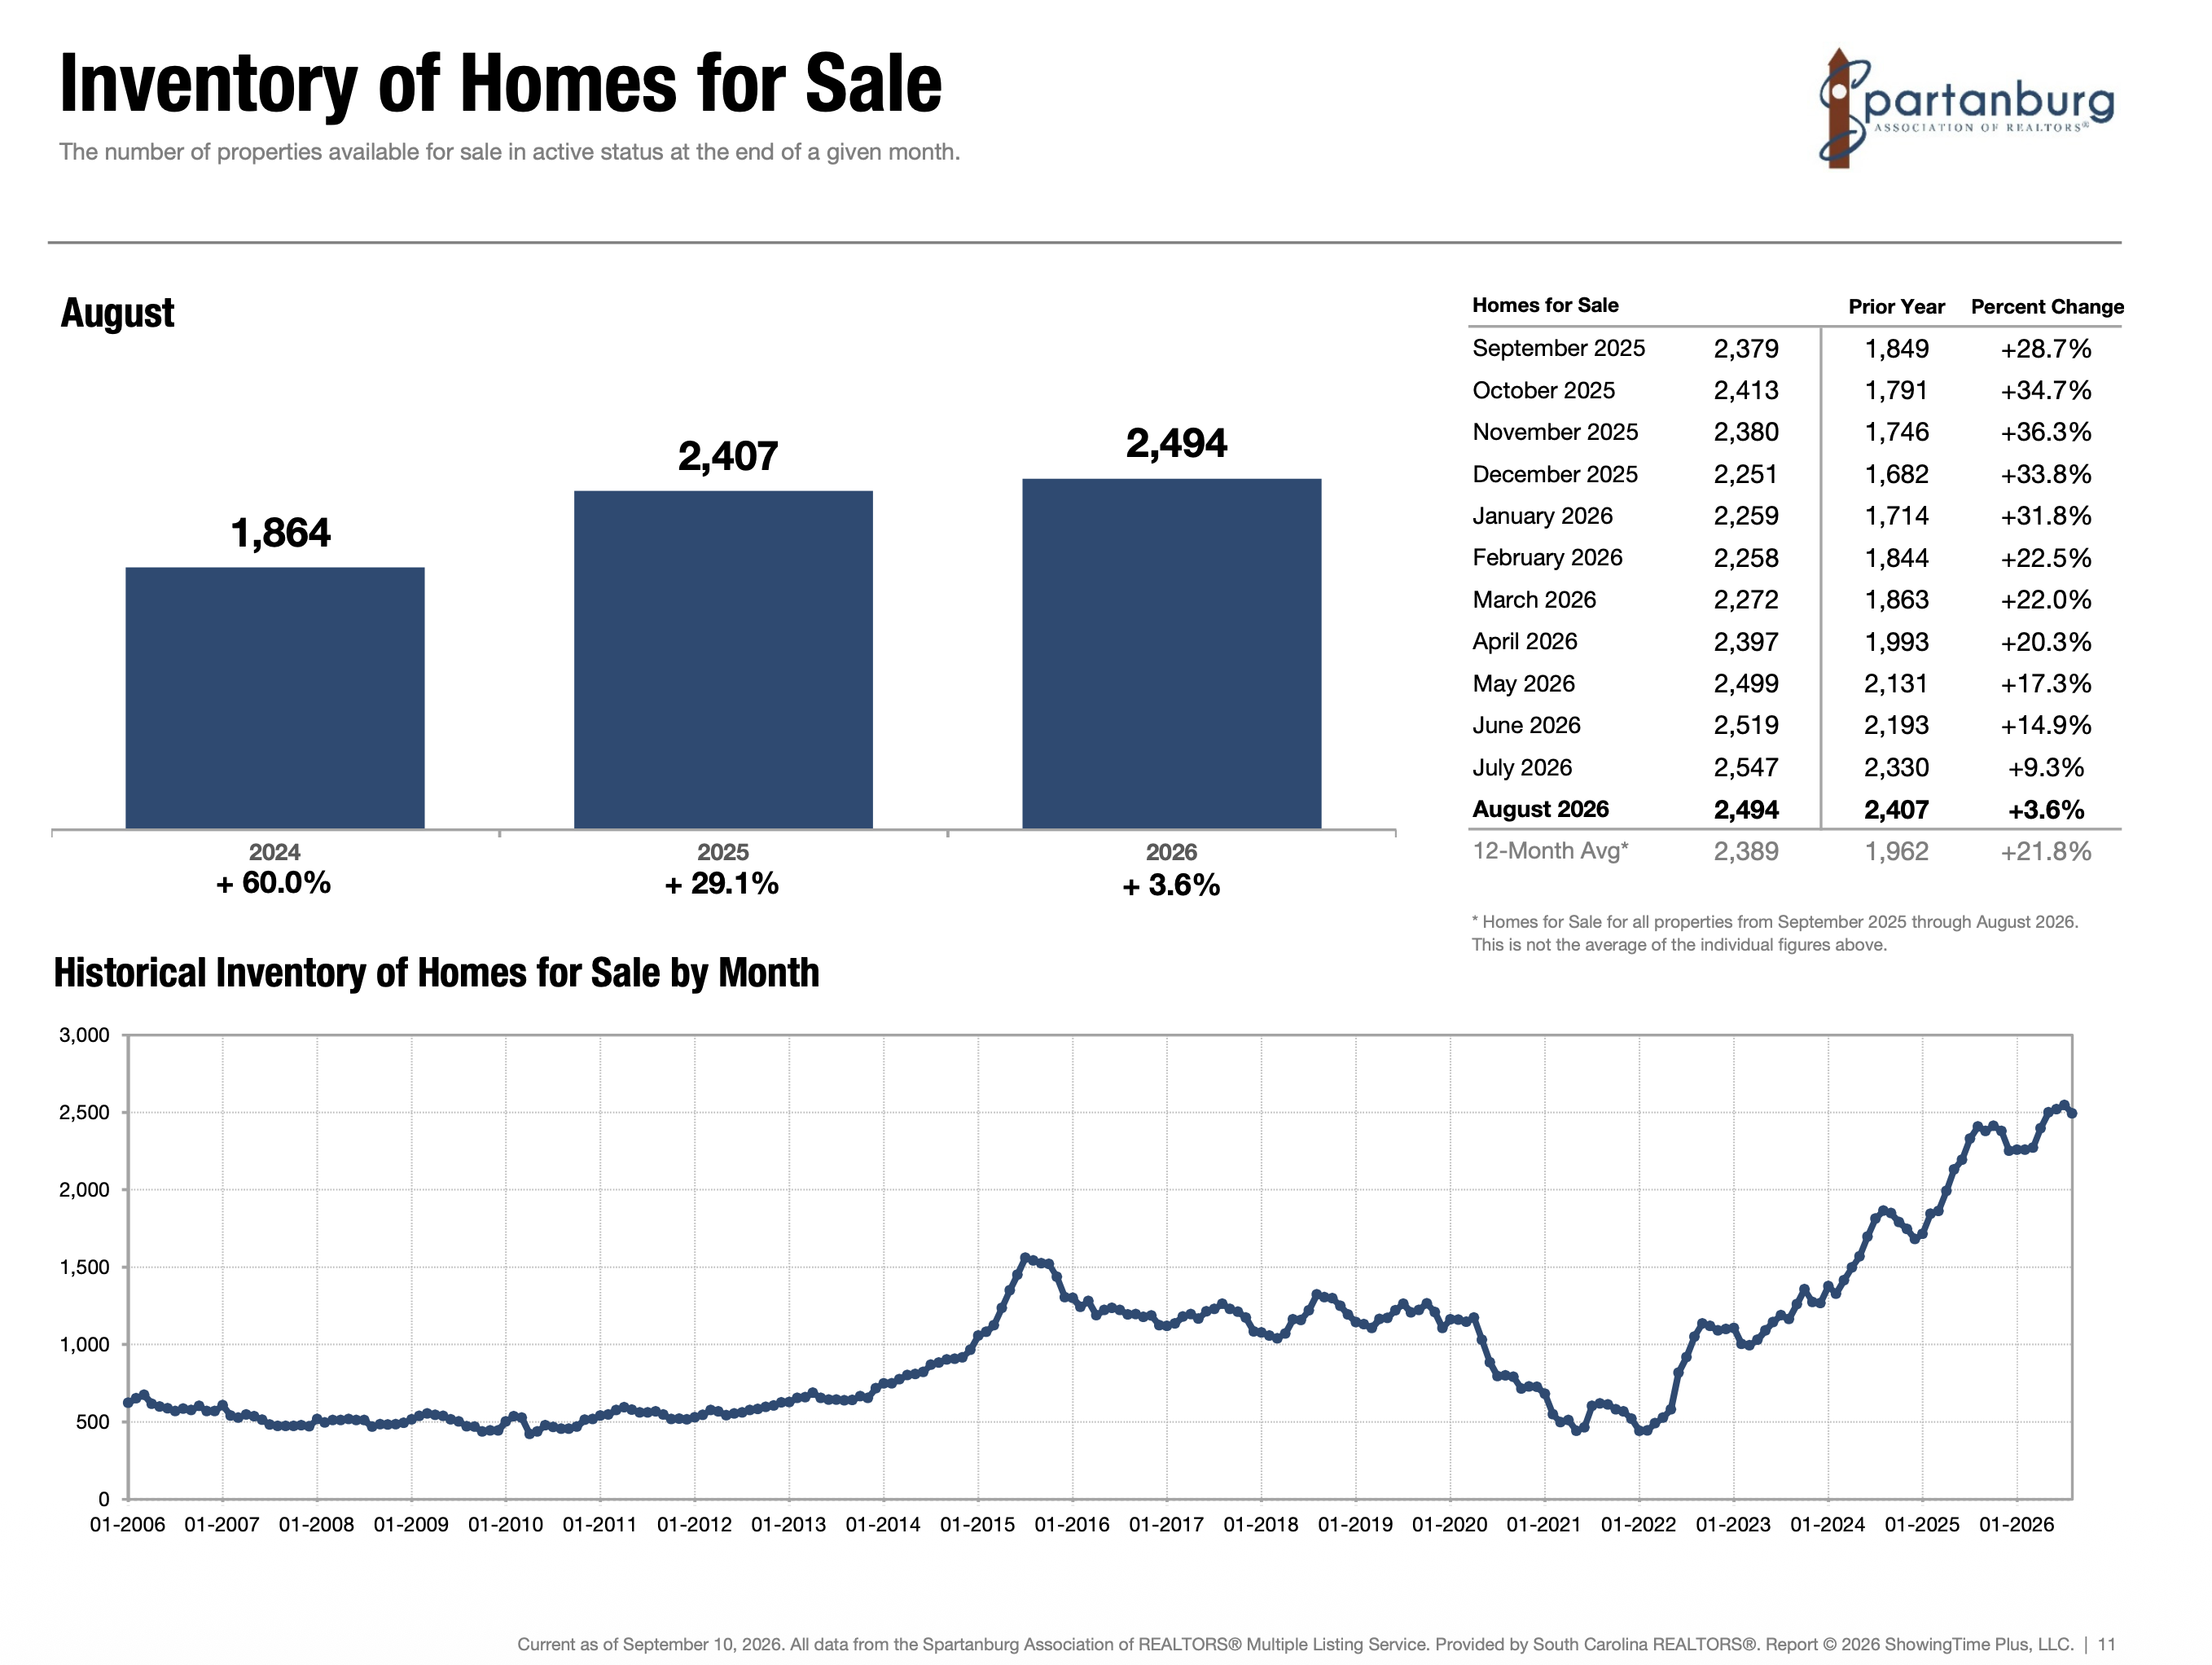
Inventory of Homes for Sale, SAR
Sales Activity is Becoming More Uneven
The divergence becomes even clearer when looking at closed sales.
Greater Greenville recorded 1,544 closed sales in August, up 0.9% from August 2025. Through the first eight months of the year, closed sales are 4.4% ahead of the same period last year.
Spartanburg moved in the opposite direction. August closed sales declined 4.5% year over year to 574, while year to date sales are down 1.0%. Pending sales were also down 1.2% for the month, although they remain 0.8% higher year to date.
The Western Upstate showed the most significant slowdown. August closed sales declined 15.8% from a year ago to 463. Pending sales fell 41.6% for the month, while year to date closed sales are down 5.4% and pending sales are down 7.3%.
Those figures should not be minimized. They indicate that the additional supply entering parts of the Upstate is not being absorbed at the same pace everywhere.
At the same time, one month does not establish a long term direction on its own. The broader data provides some important context, particularly in Greater Greenville and Spartanburg.
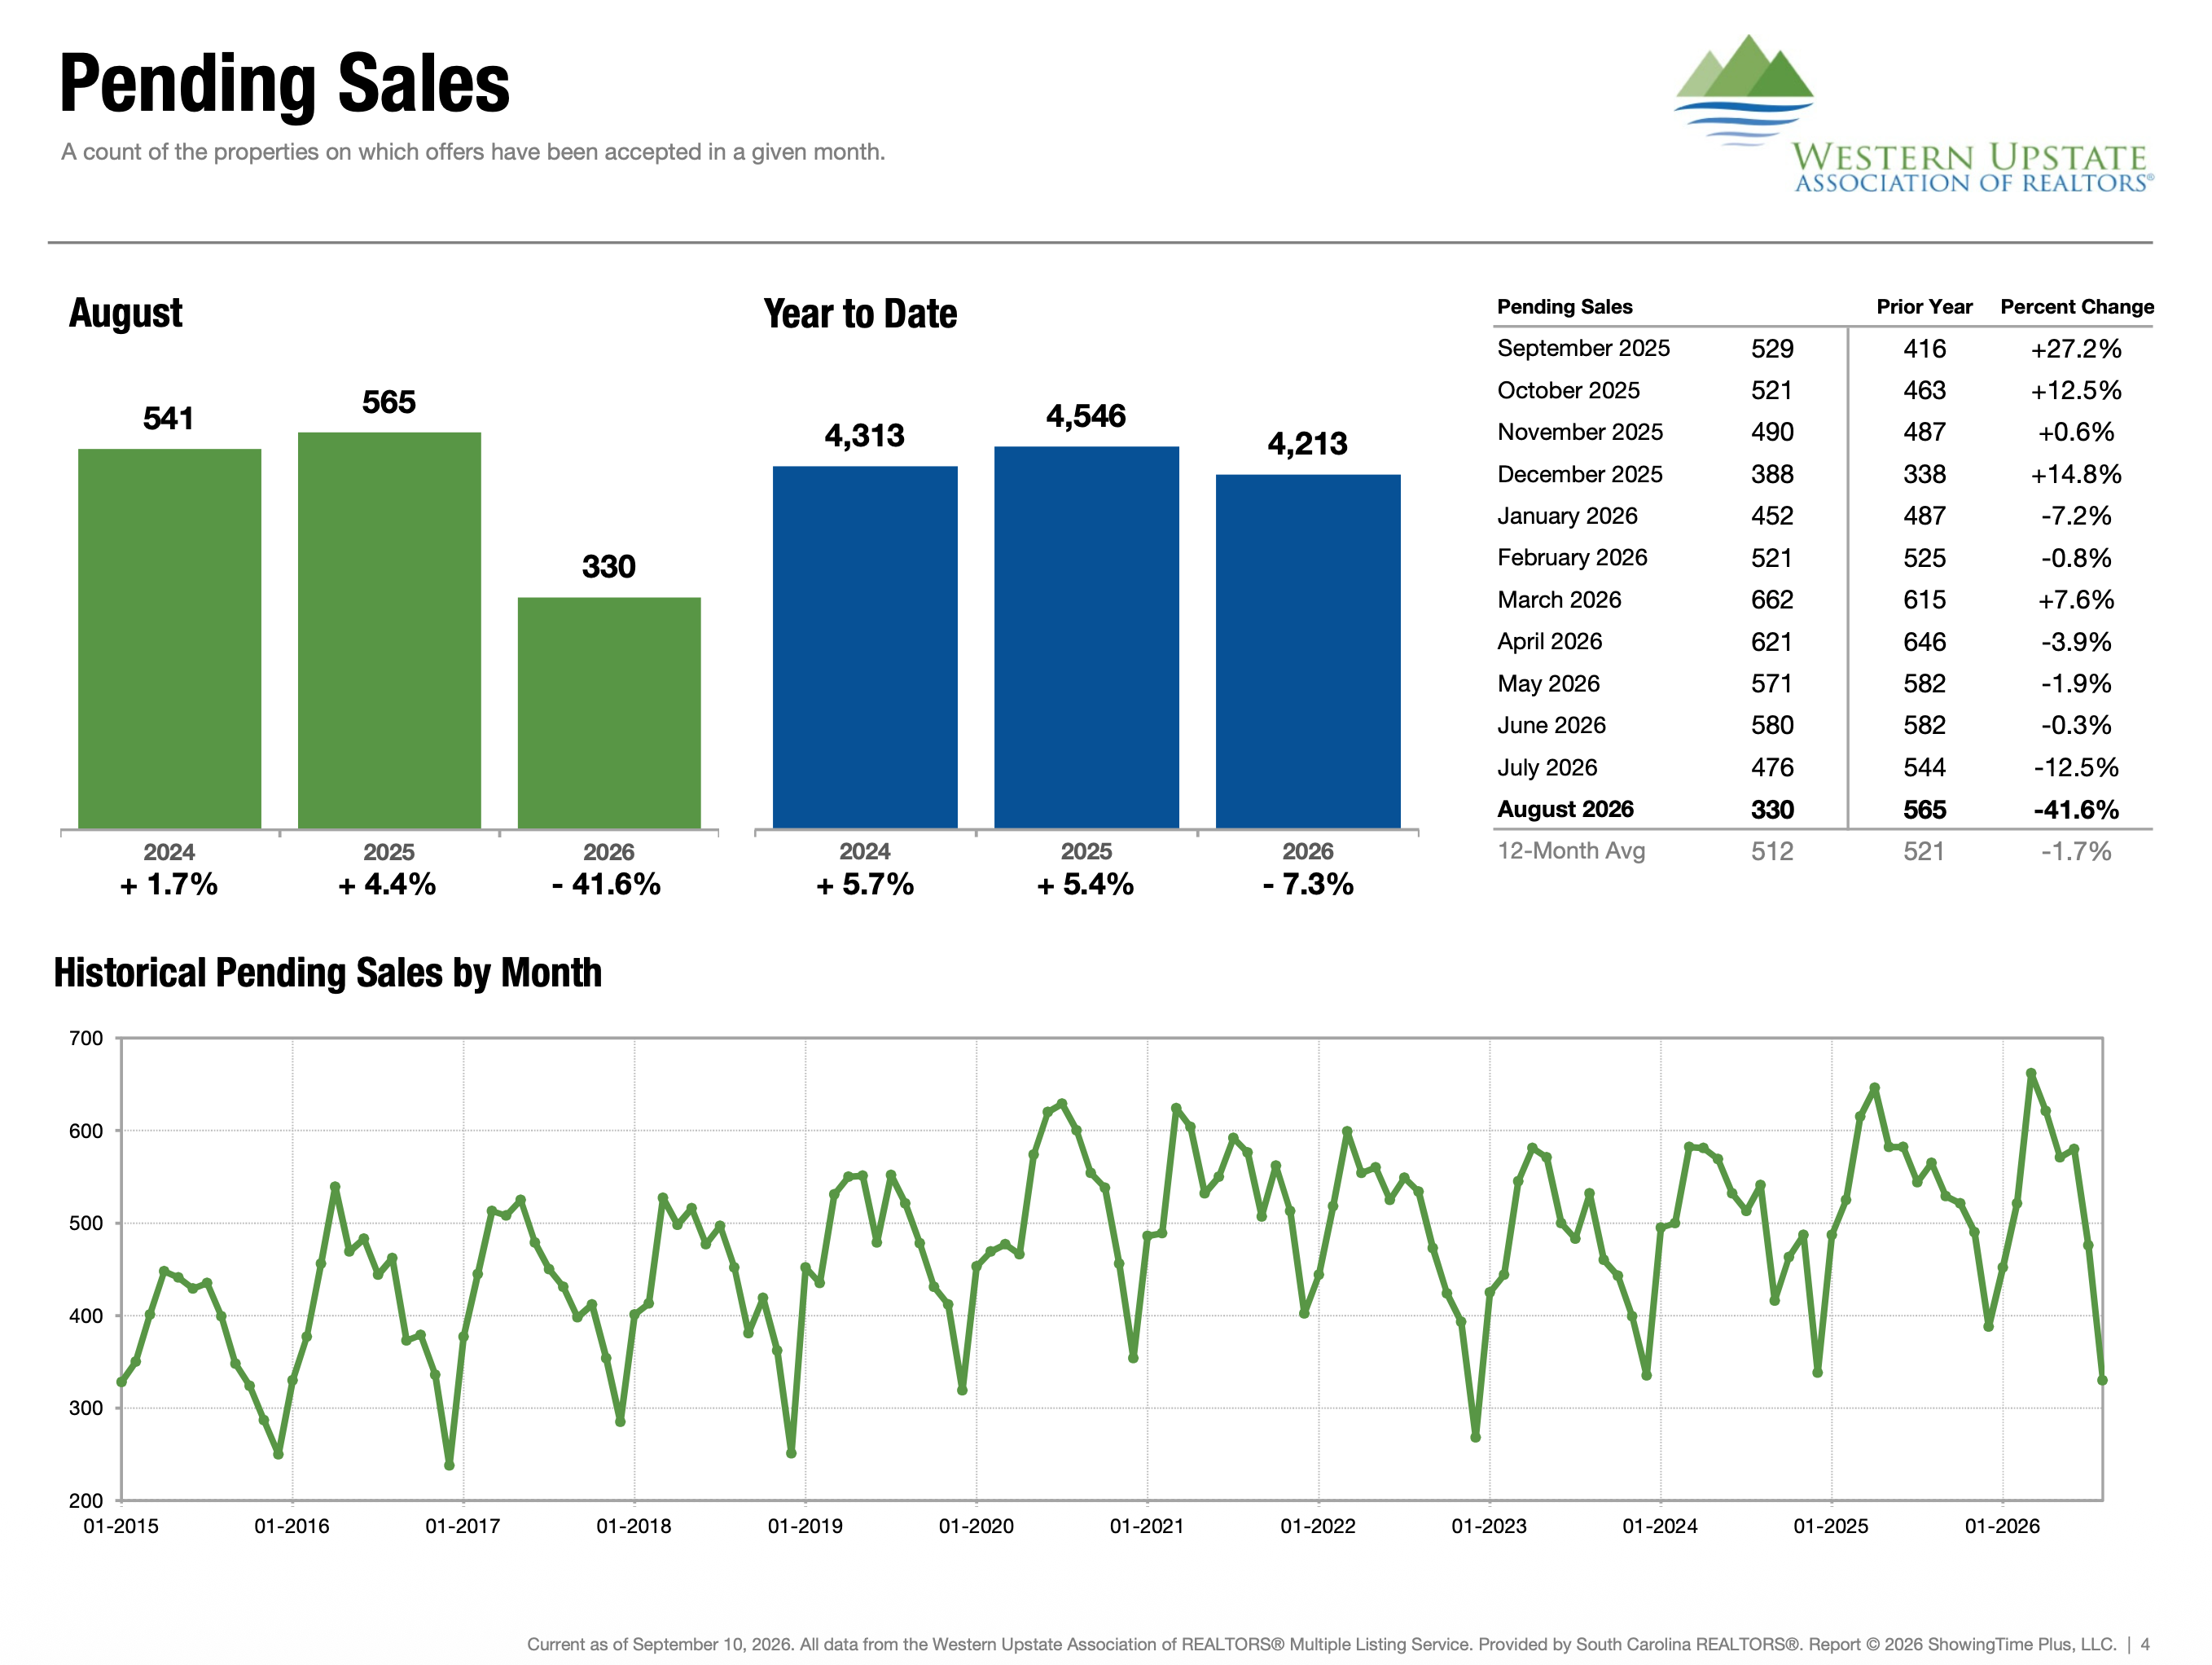
Pending Sales, WUMLS
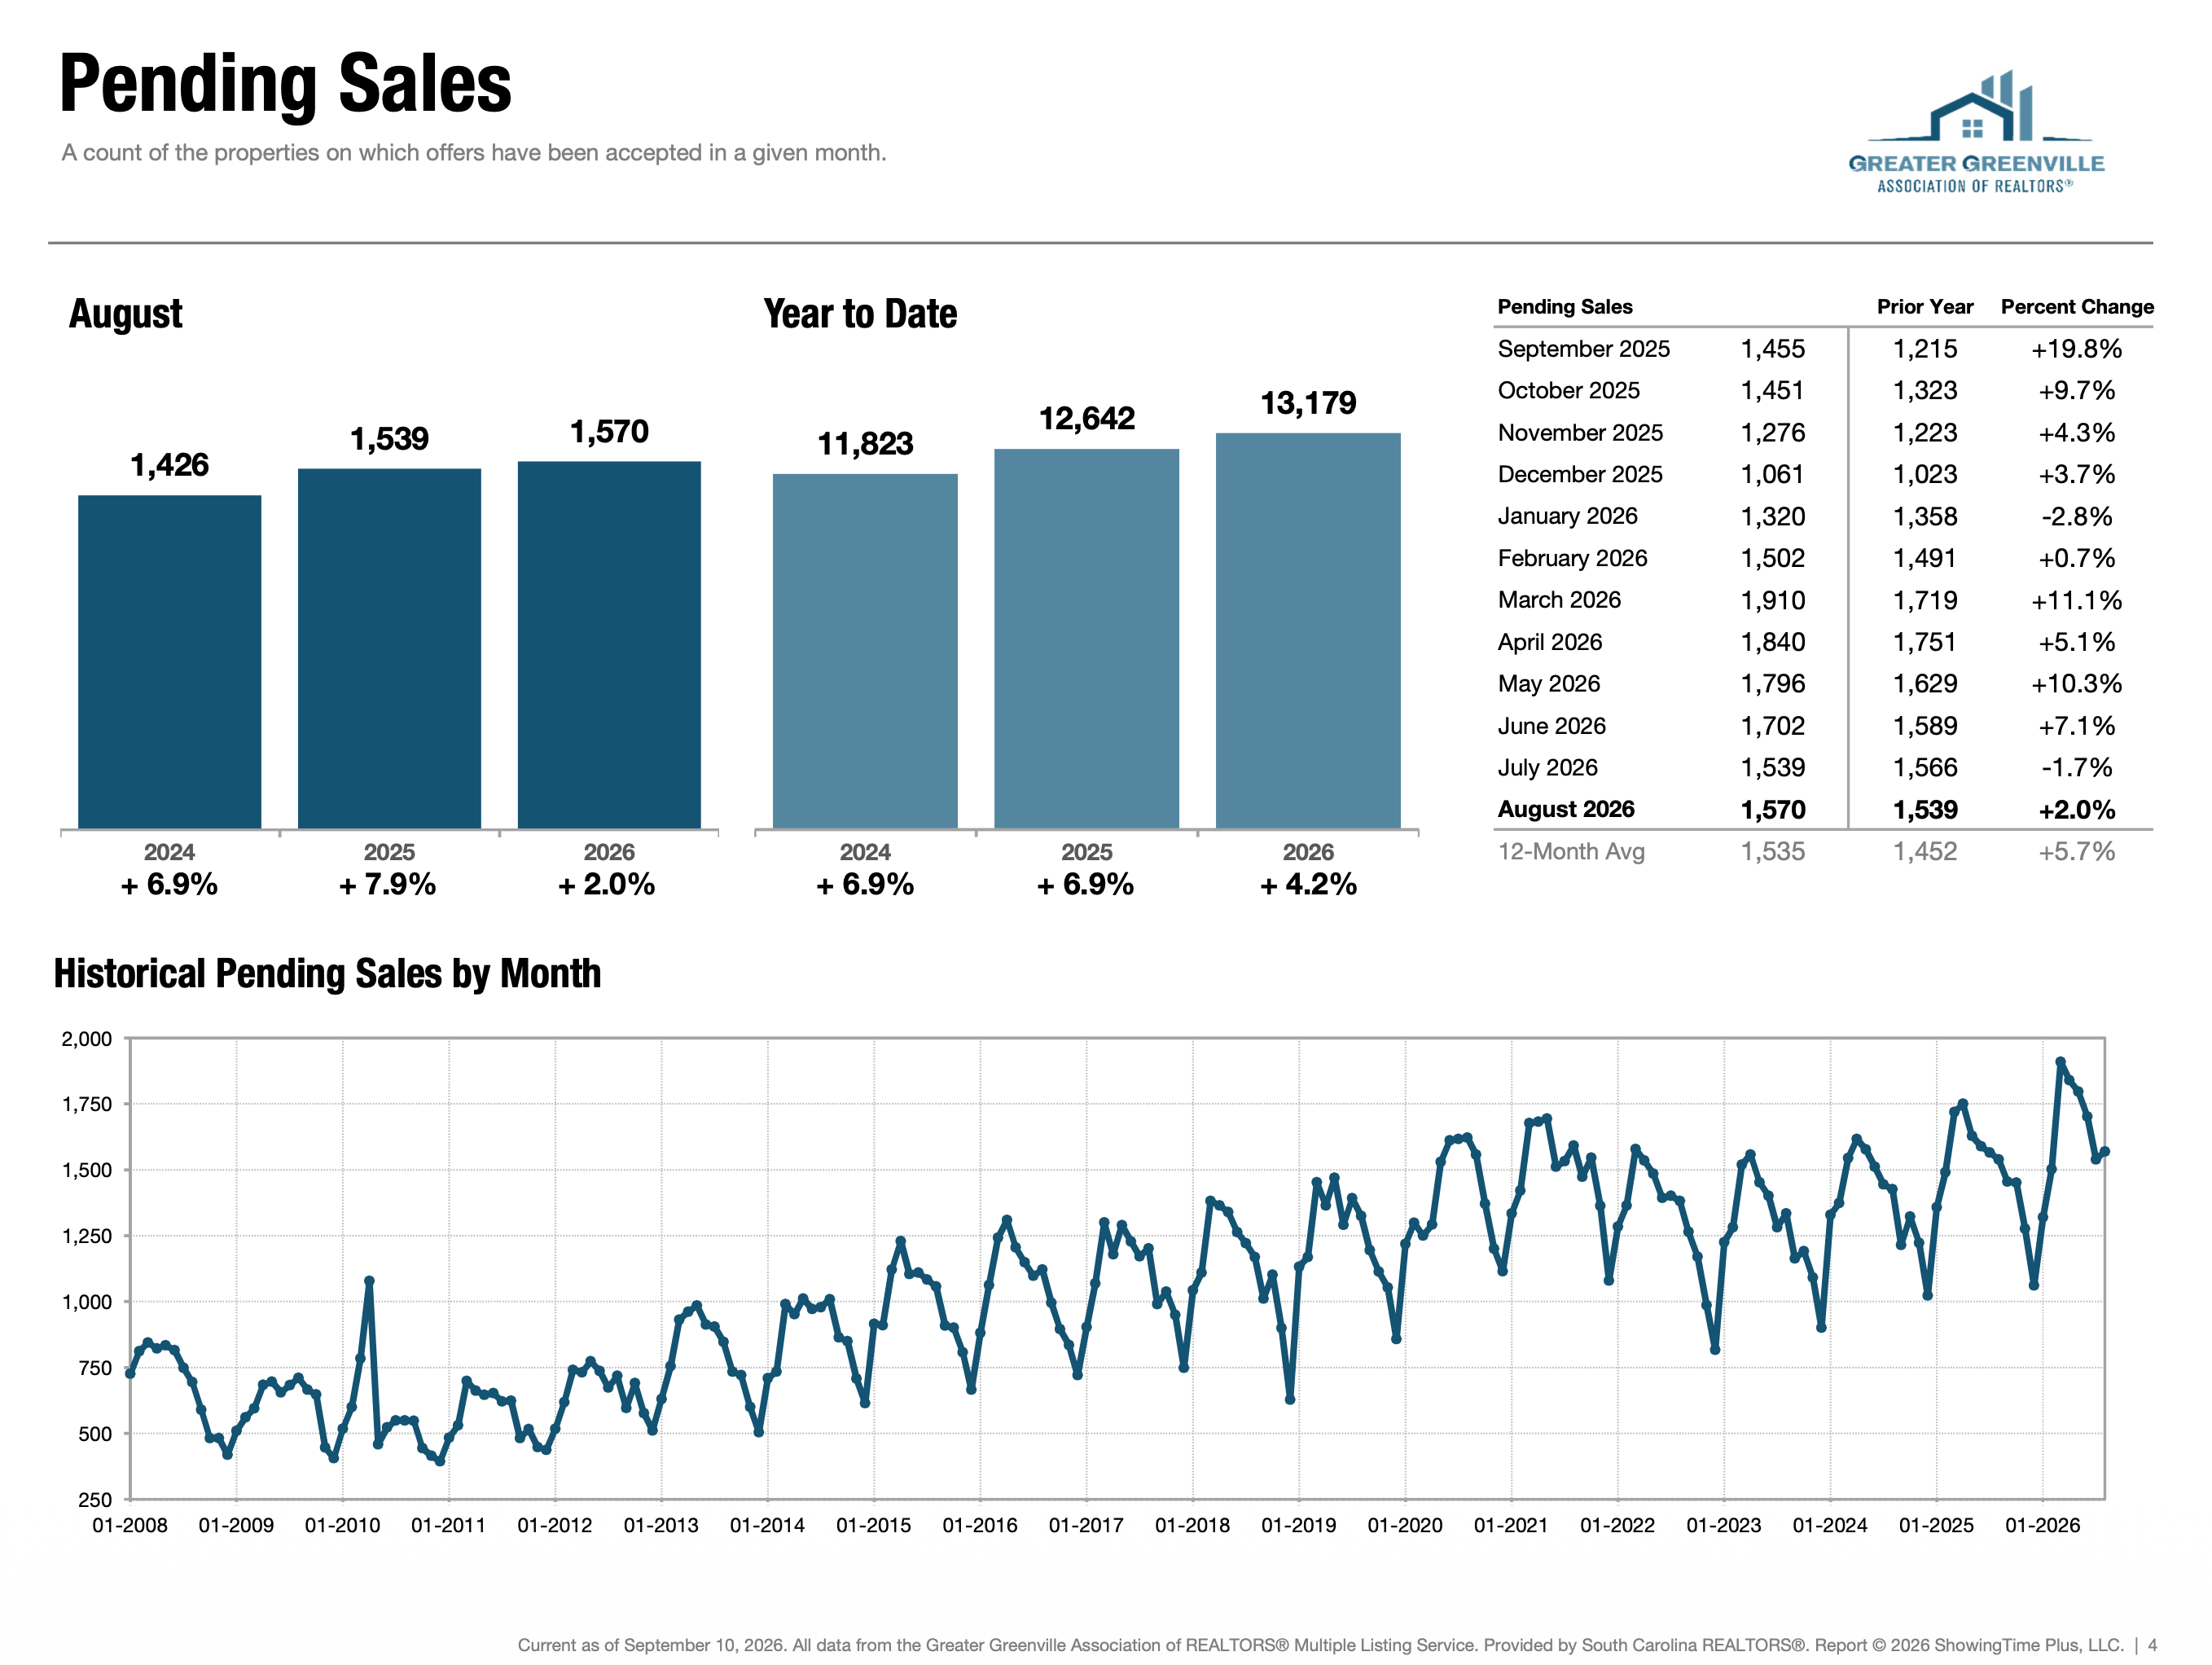
Pending Sales, GGAR
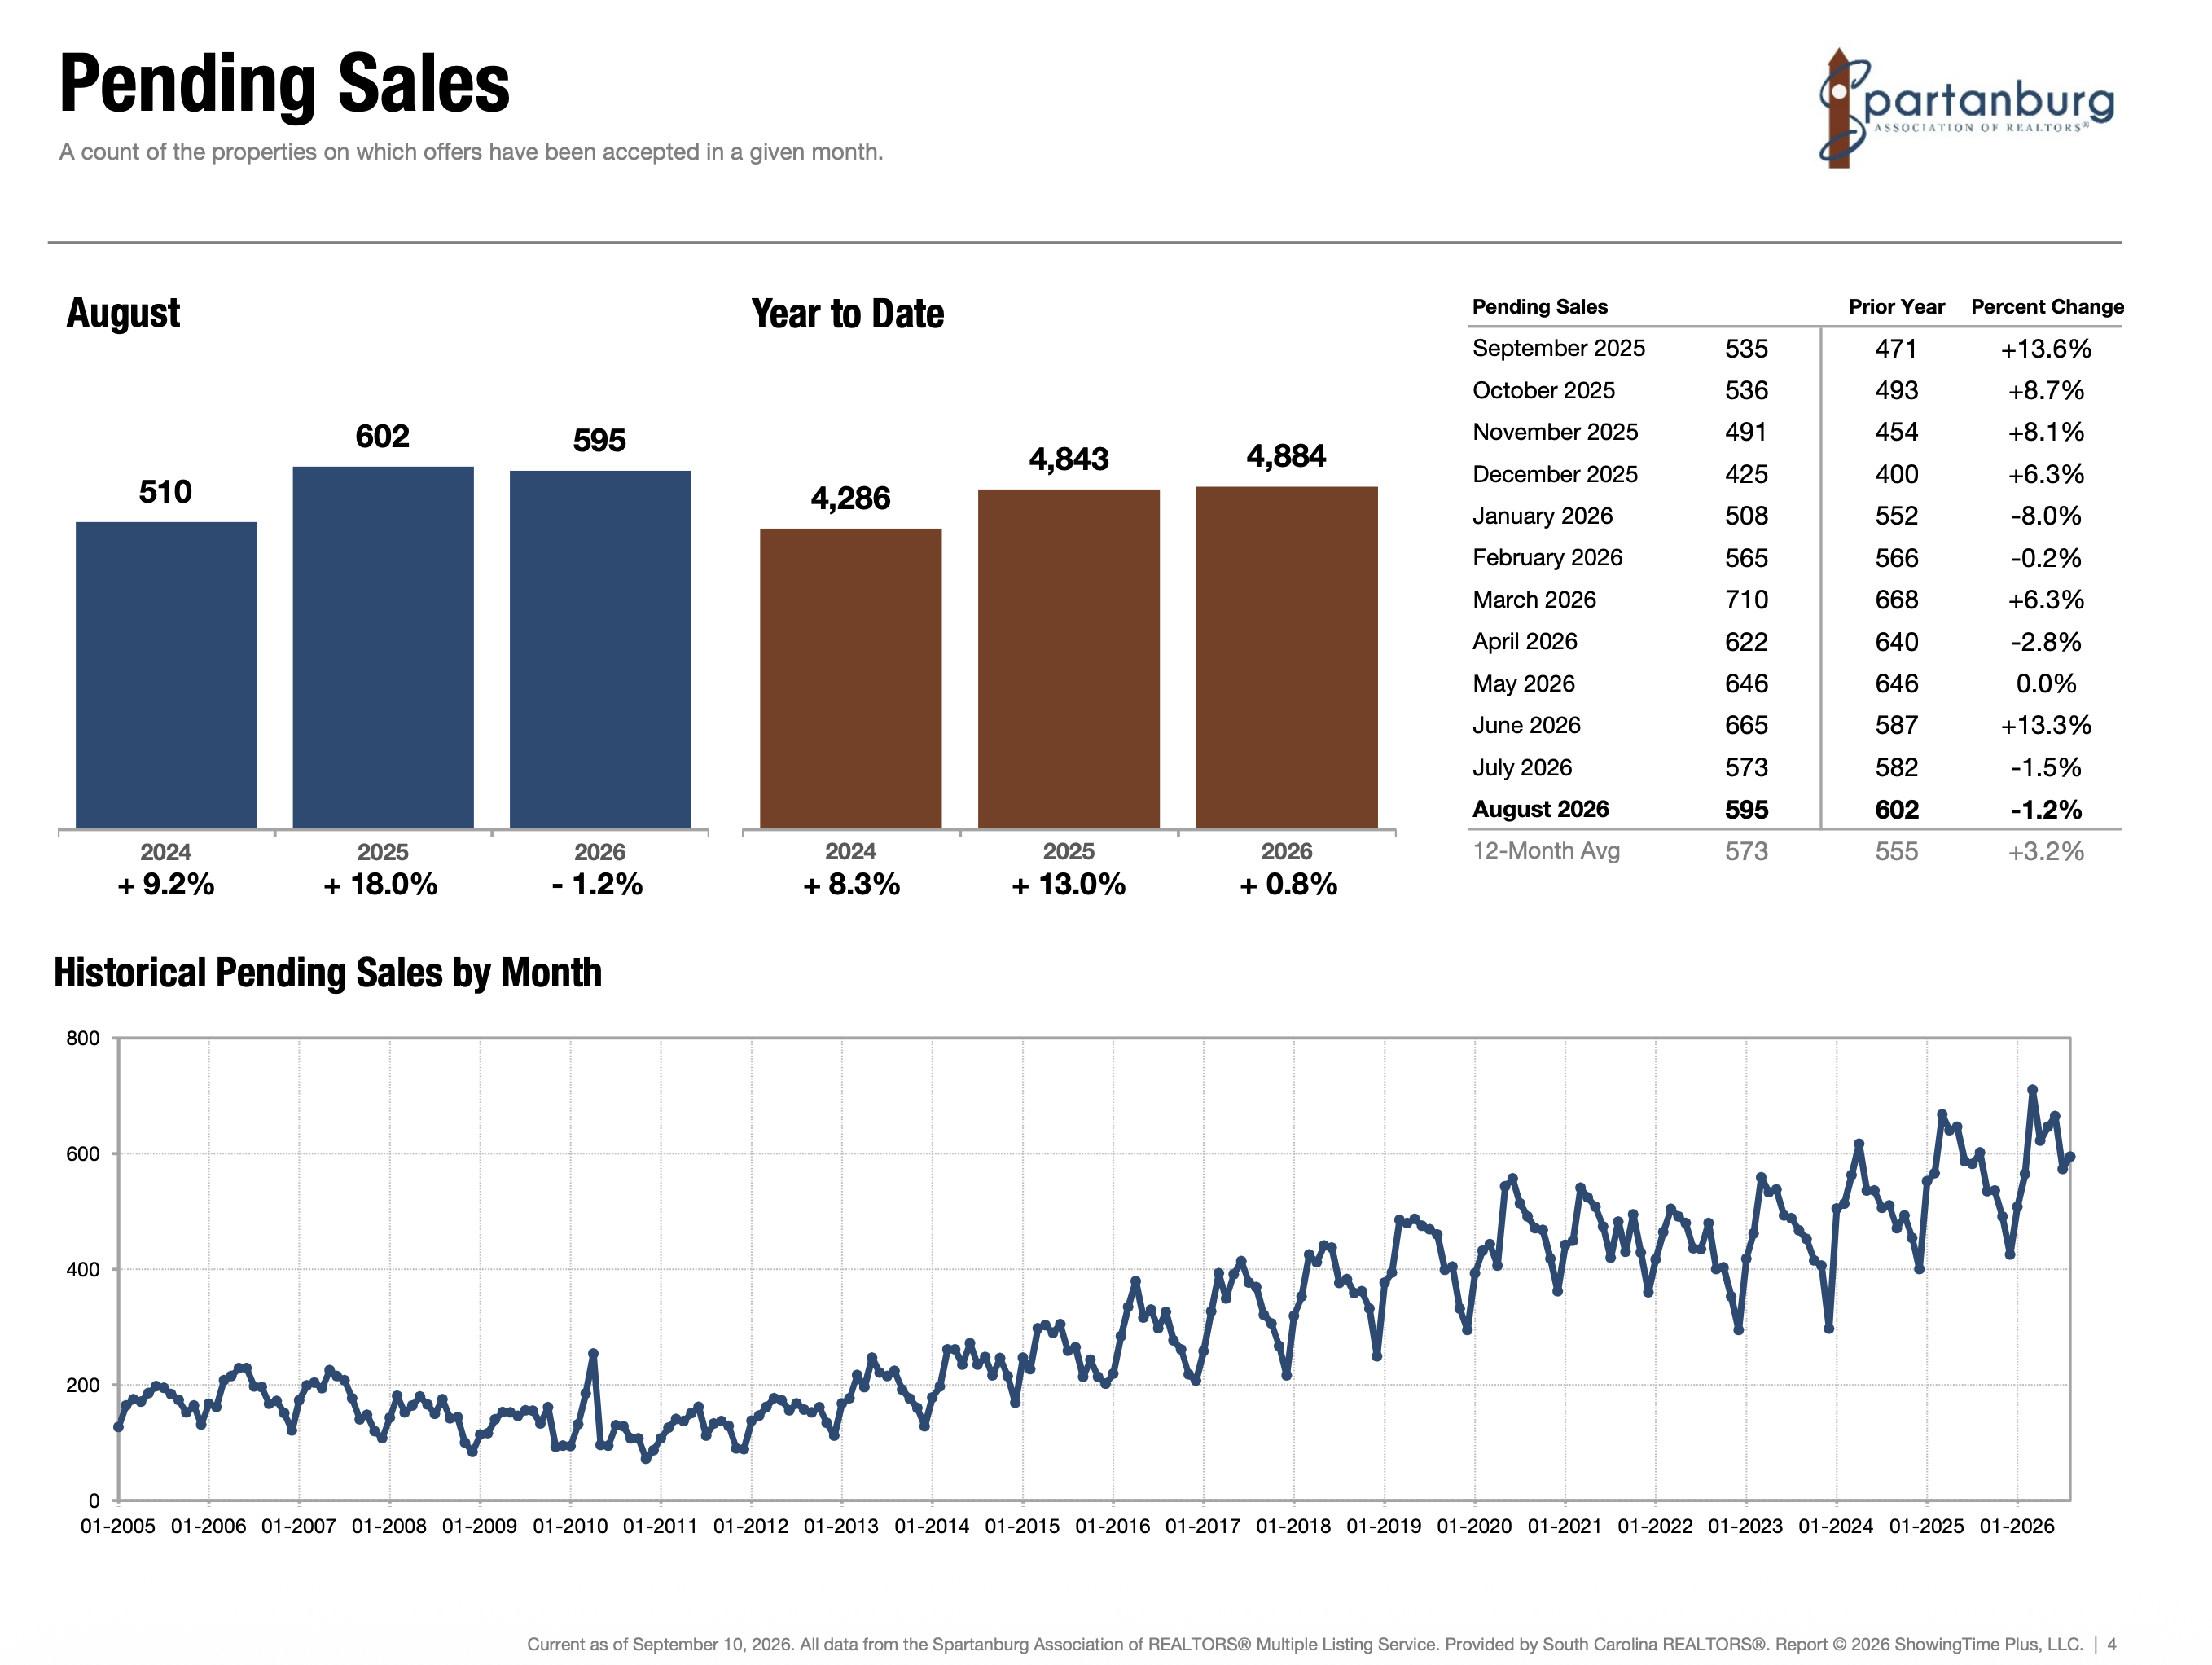
Pending Sales, SAR
Longer Marketing Times Are Changing the Pace of the Market
Across all three markets, homes are taking longer to sell than they were a year ago.
Greater Greenville's average days on market increased 14.3% to 56 days. Spartanburg saw a considerably larger increase, from 40 days in August 2025 to 64 days this August, a 60% year over year increase. Western Upstate homes averaged 78 days on market, up 14.7%.
This is one of the clearest indications that buyers have regained some time in the transaction.
Longer marketing periods do not necessarily mean homes are not selling. They do suggest buyers can be more deliberate, particularly when several comparable properties are available. For sellers, expectations formed during periods of extremely limited inventory may no longer reflect current conditions.
A well positioned property can still attract meaningful interest, but the market is increasingly differentiating between homes based on price, condition, location, and overall presentation.
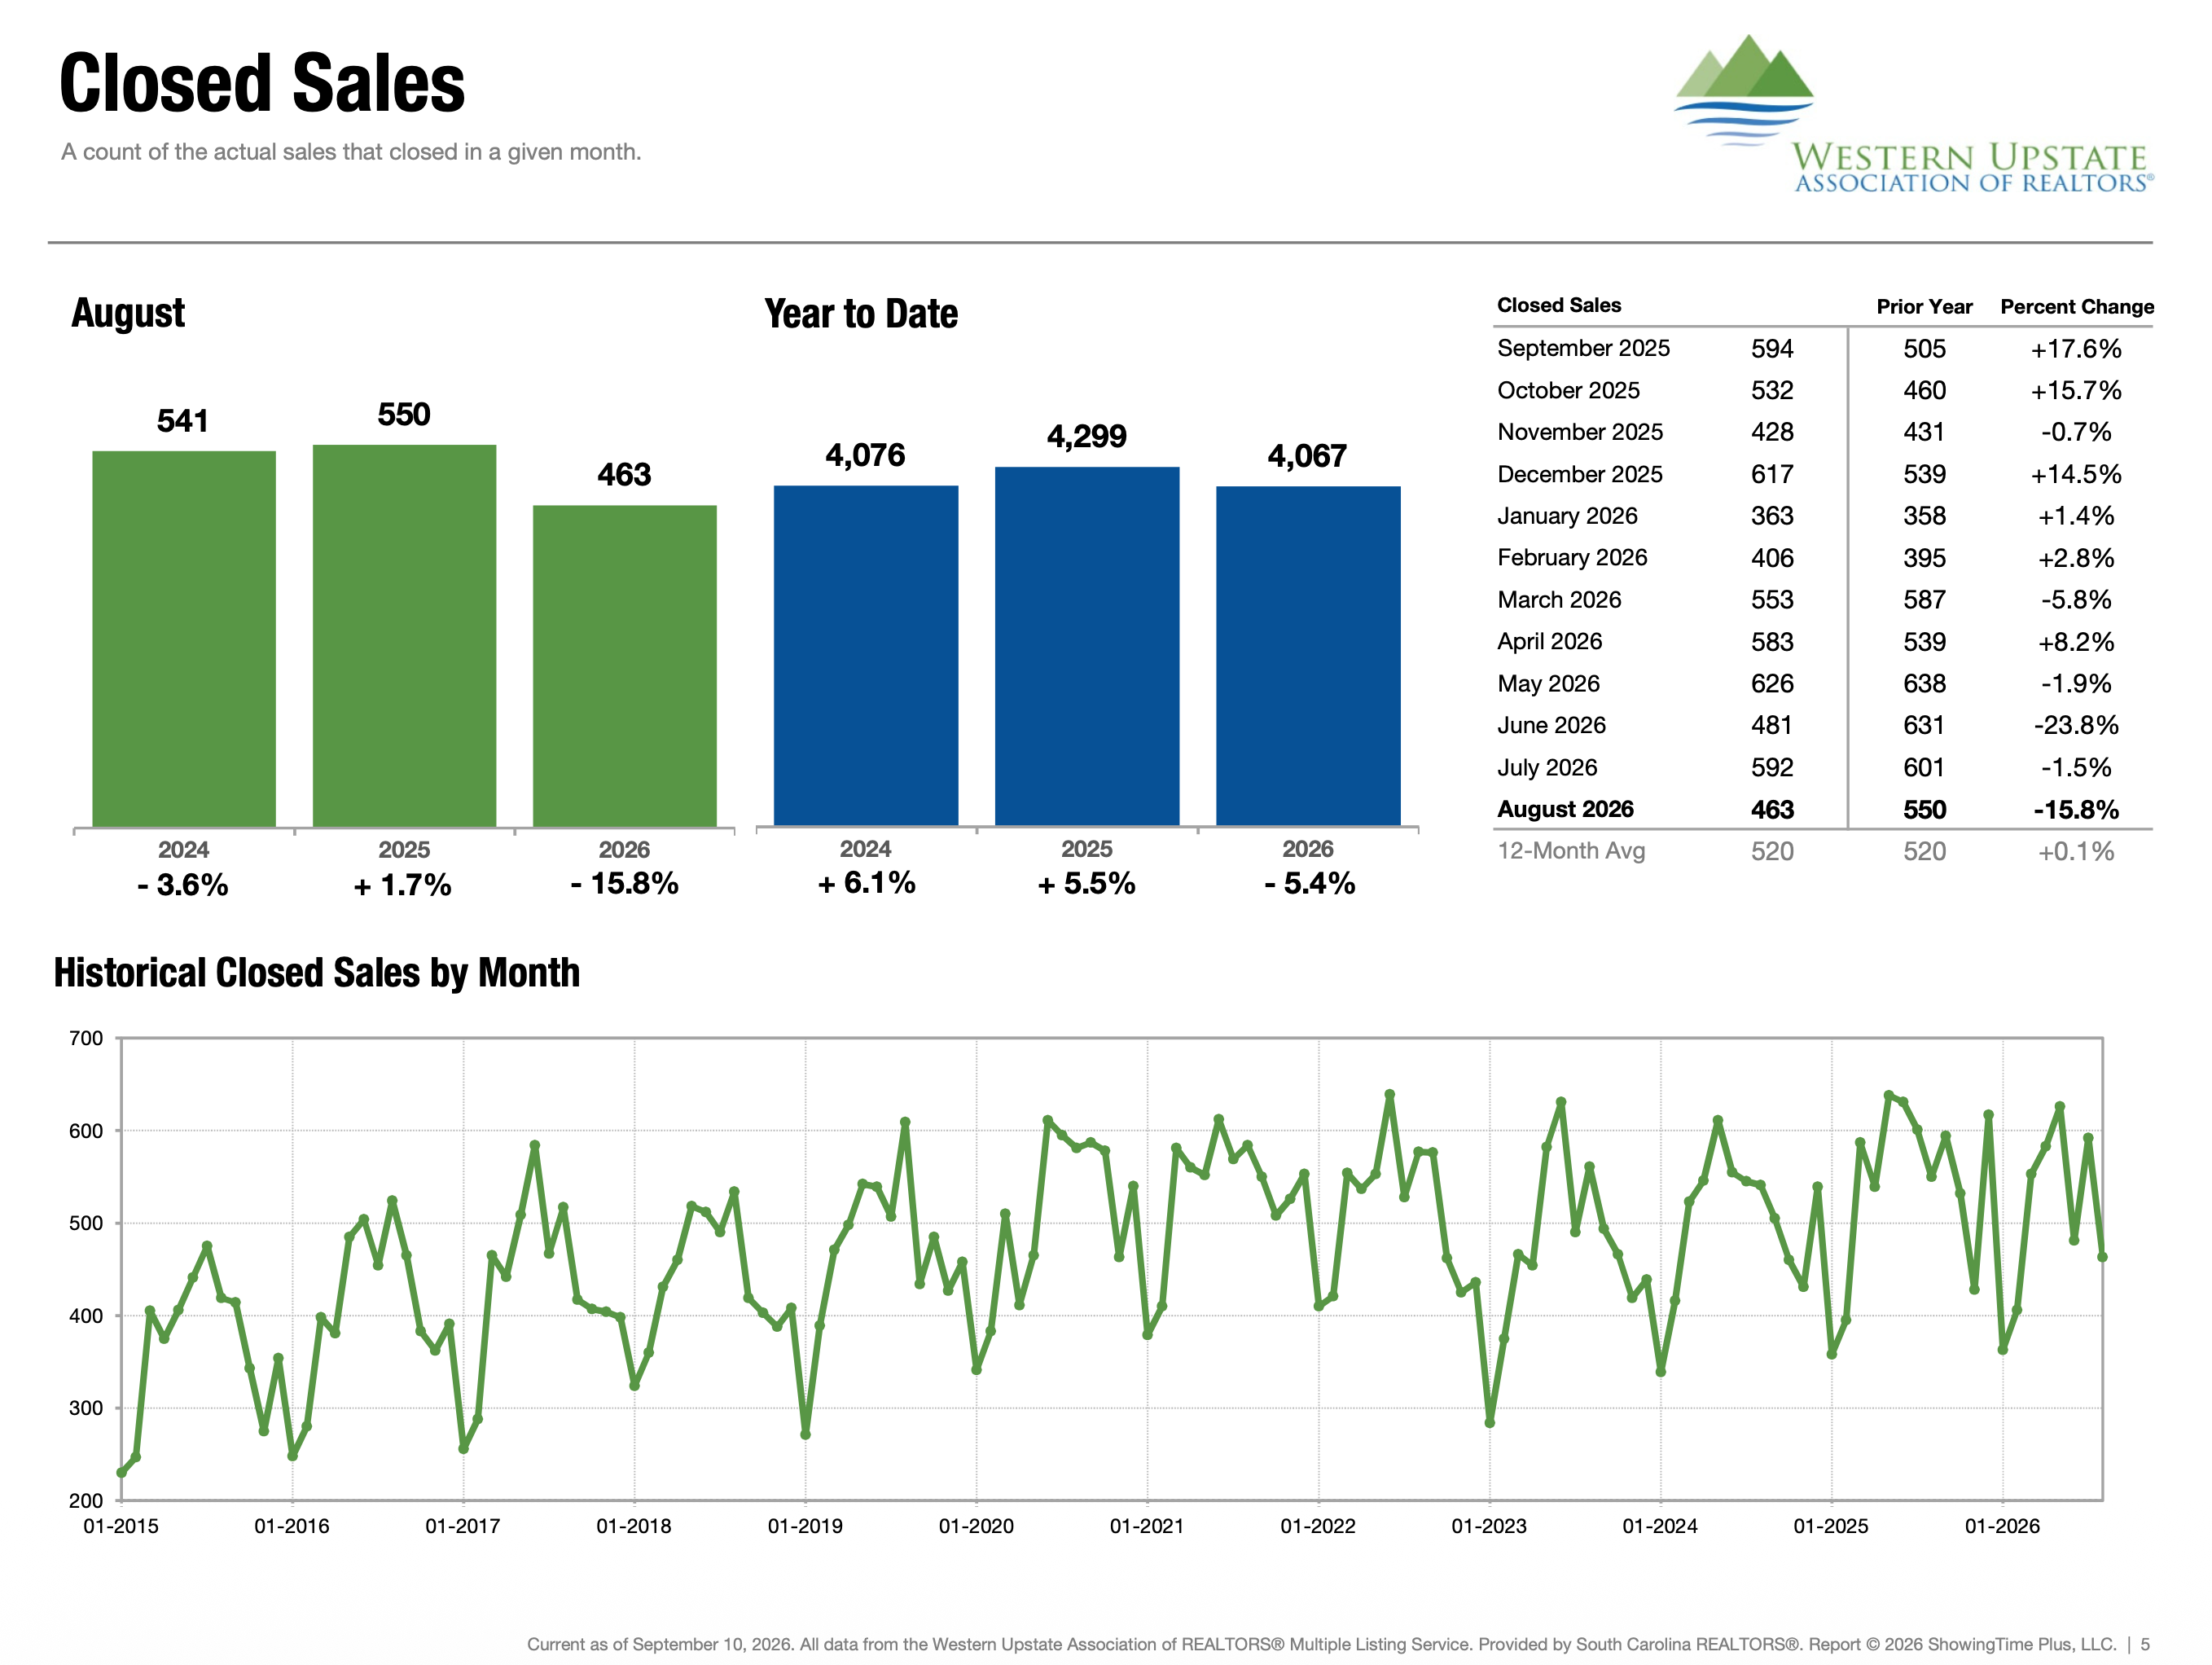
Closed Sales, WUMLS
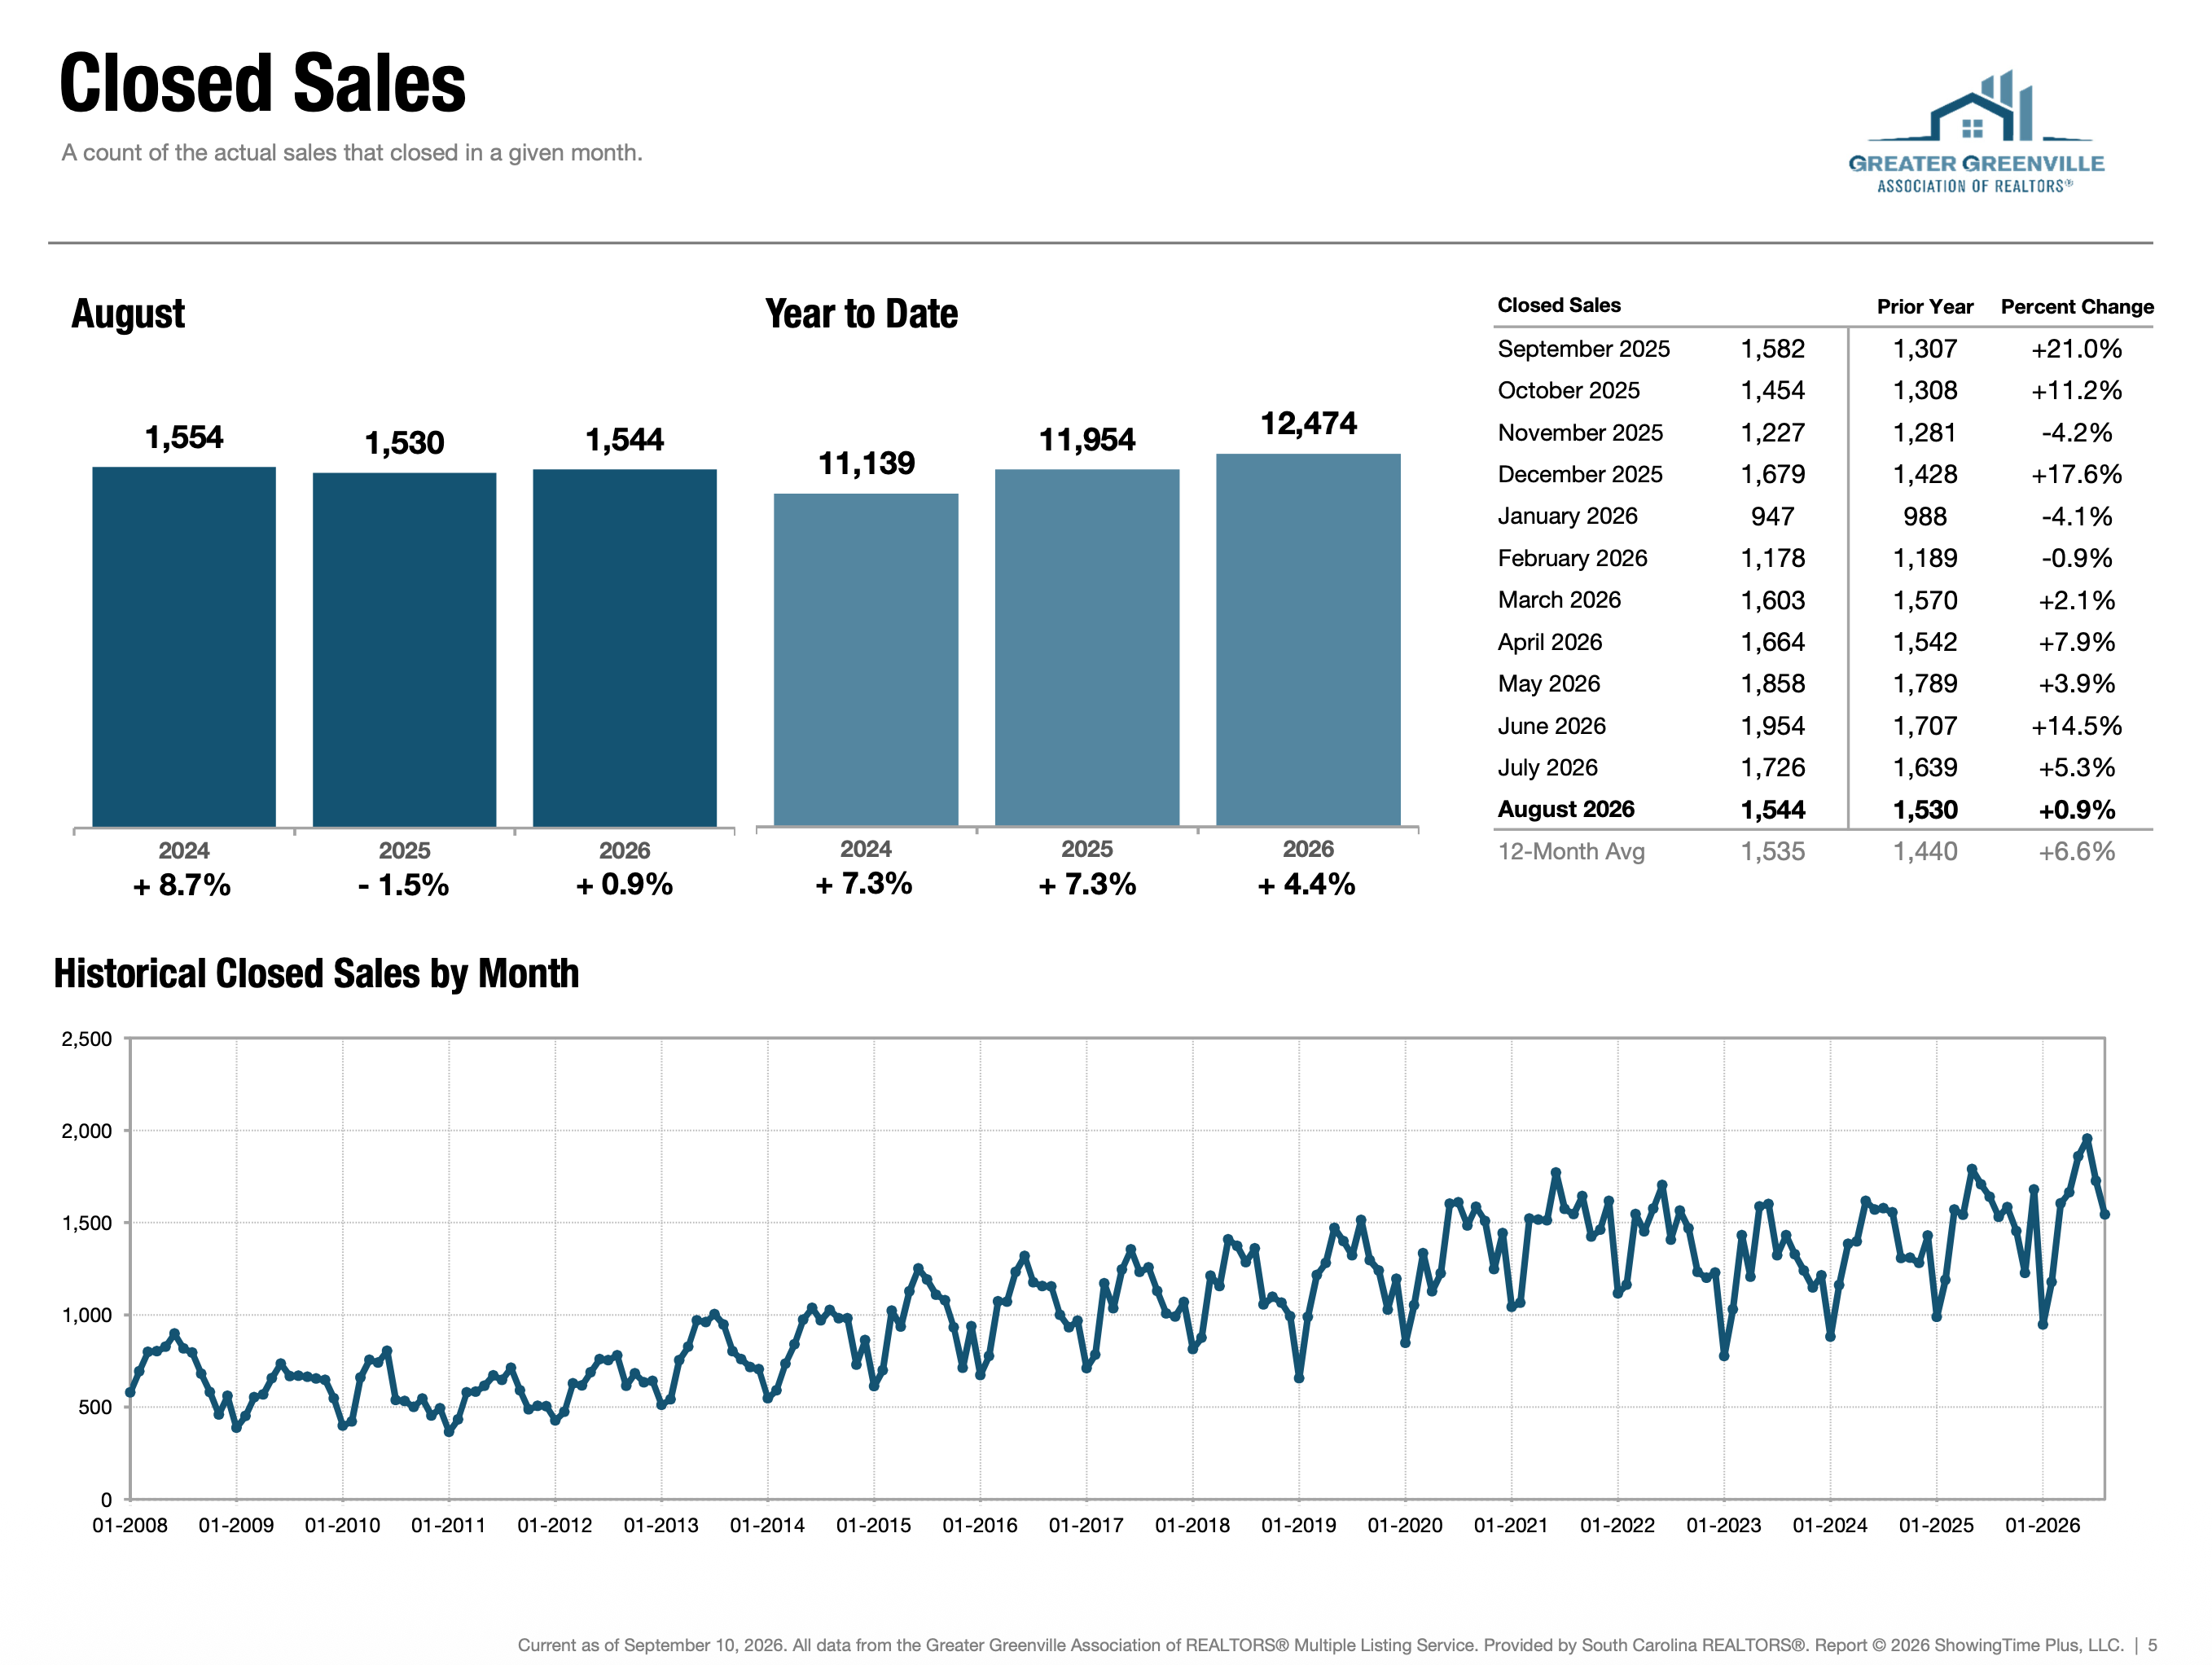
Closed Sales, GGAR
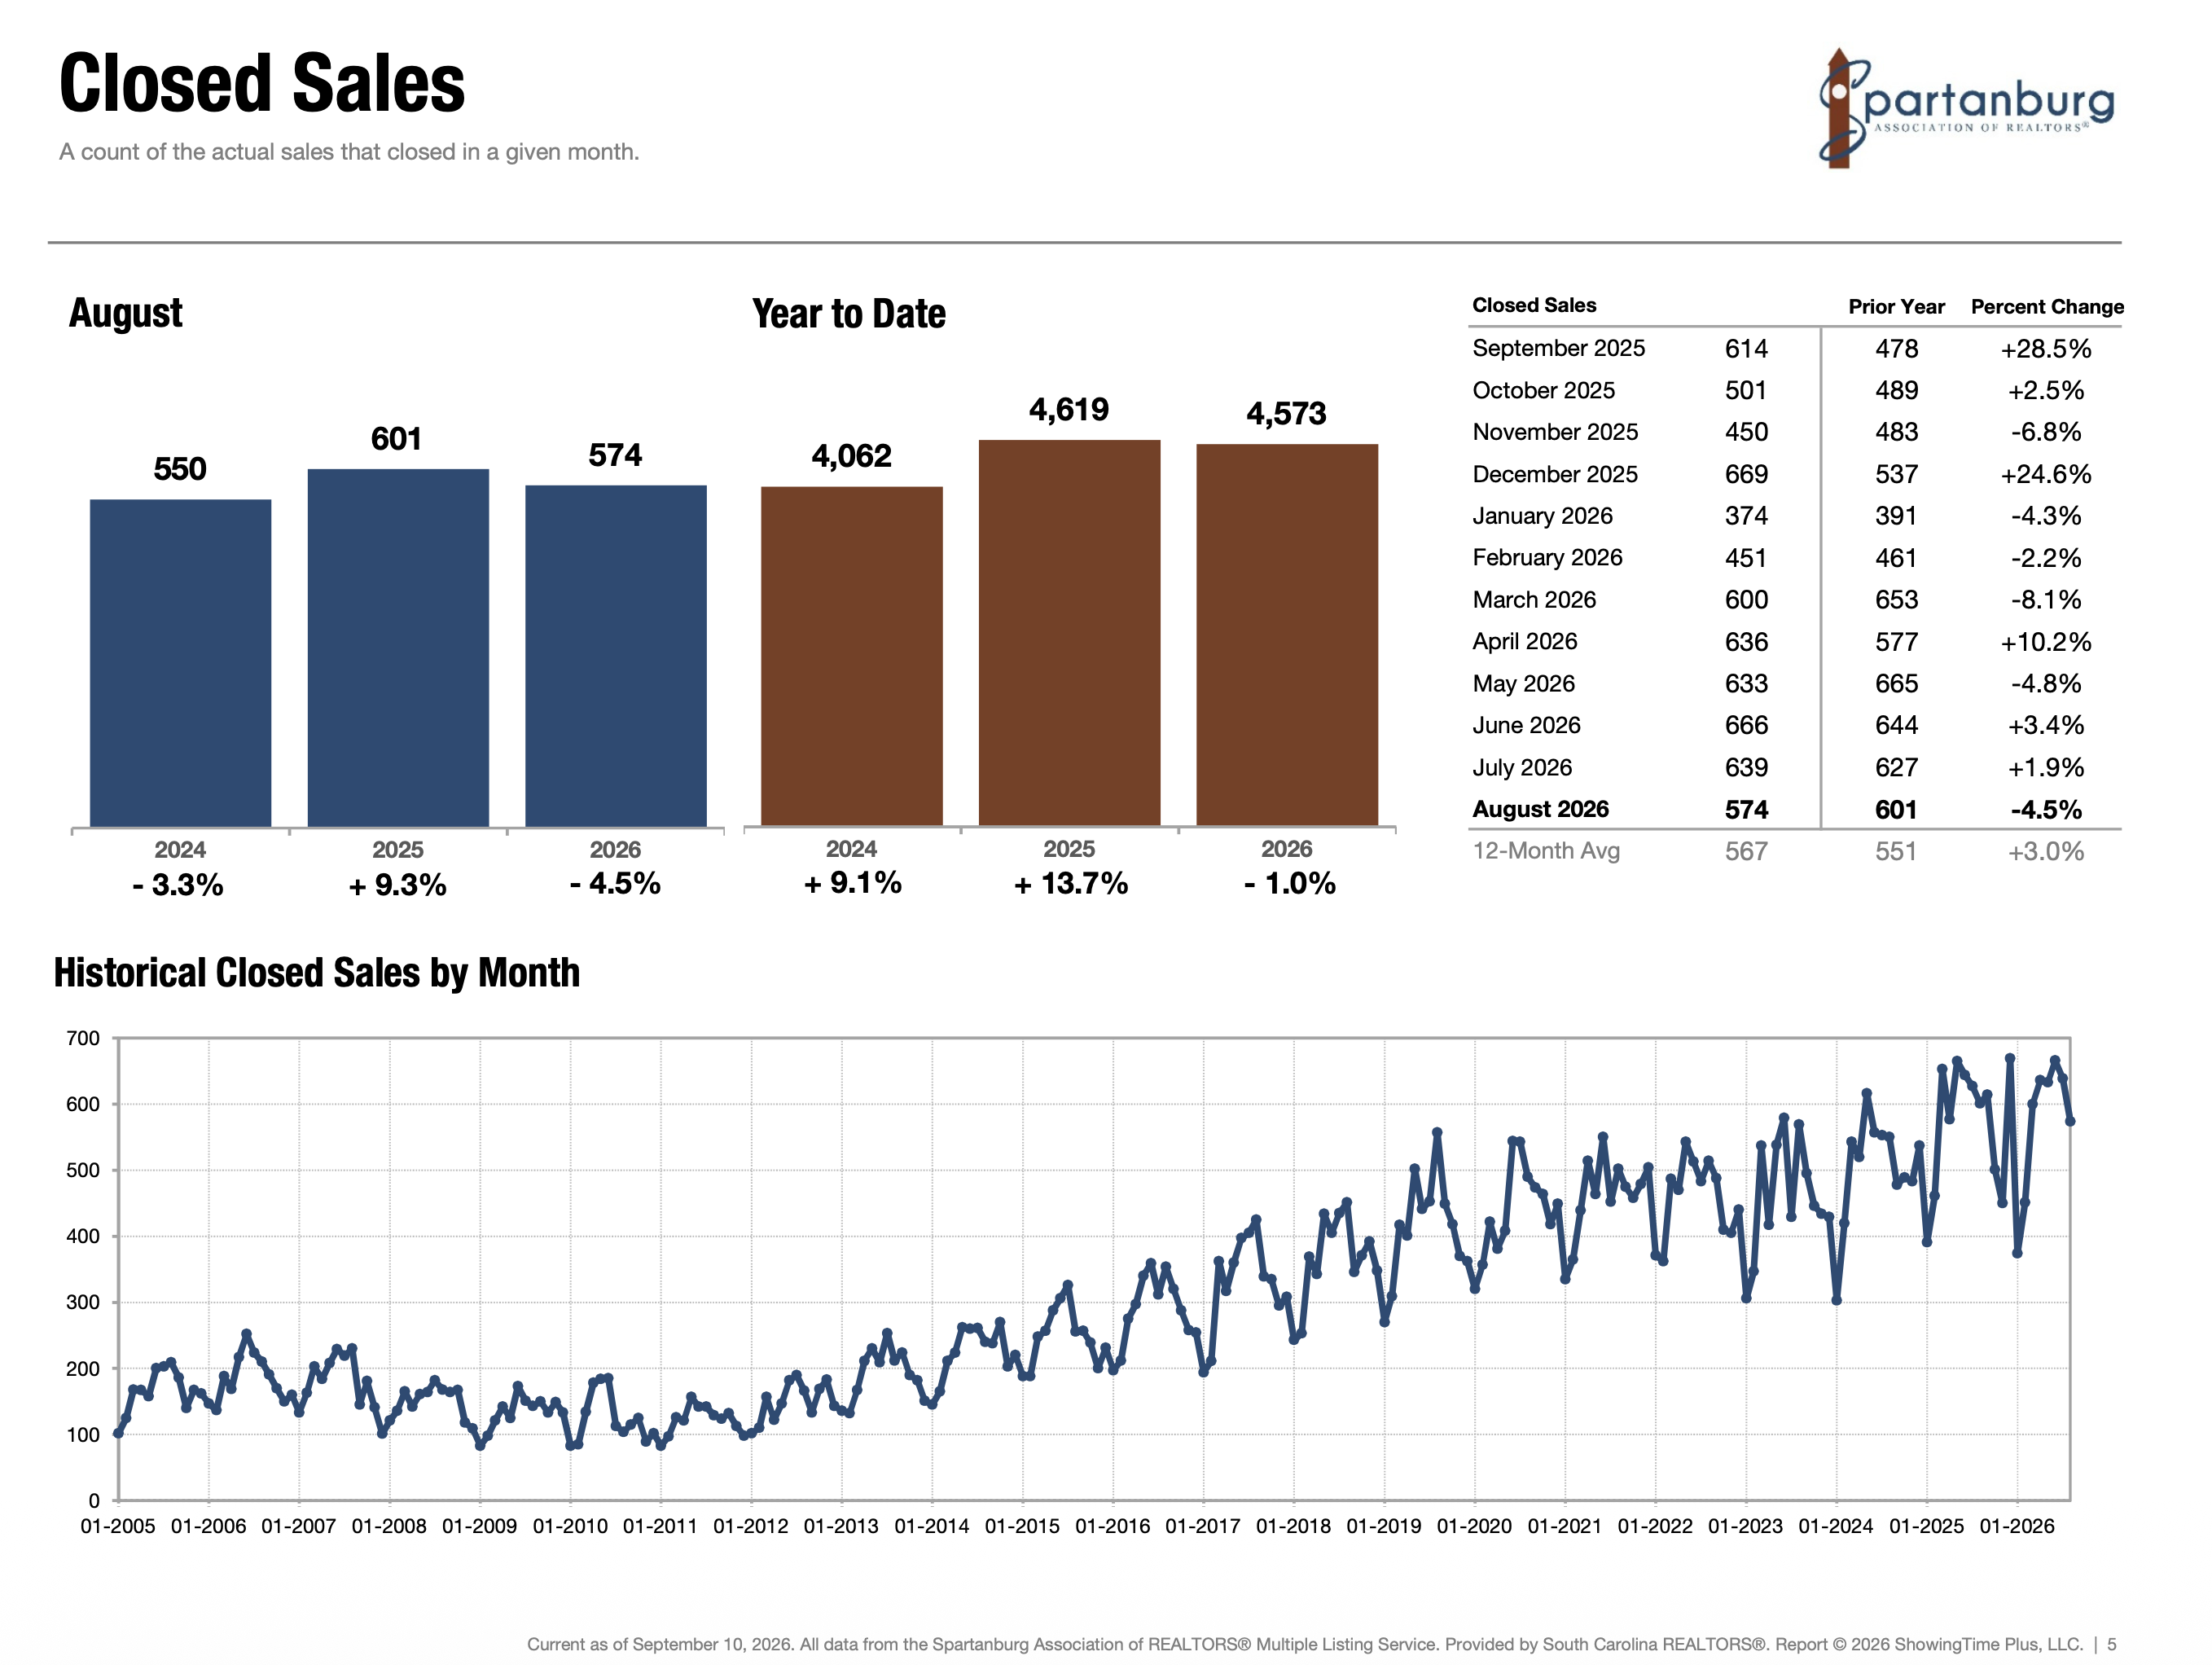
Closed Sales, SAR
Pricing is Holding Better Than Sales Activity Alone Might Suggest
Despite slower conditions in portions of the Upstate, August did not produce a broad decline in home values.
Greater Greenville's median sales price was $320,000, down 1.5% from August 2025, while its average sales price increased 4.5% to $414,737.
Spartanburg's median price declined 2.4% to $292,500 and its average price declined 1.5% to $326,792. Year to date, the median stands at $290,000, down 1.4%, while the average is $318,170, slightly above last year's pace.
Western Upstate pricing moved in the opposite direction from its sales activity. The August median increased 0.8% to $313,000, while the average sales price rose 6.6% to $423,695. Year to date, its median is up 0.3% and its average is up 4.6%.
That combination is worth noting. A market can experience fewer transactions and more inventory without immediately producing broad price declines. Changes in the mix of homes selling from month to month can also influence both median and average prices, making longer term trends important when evaluating value.
For sellers, that distinction matters. The data does not suggest that every Upstate market is experiencing falling prices. It does suggest that buyers have become more selective about which properties justify those prices.
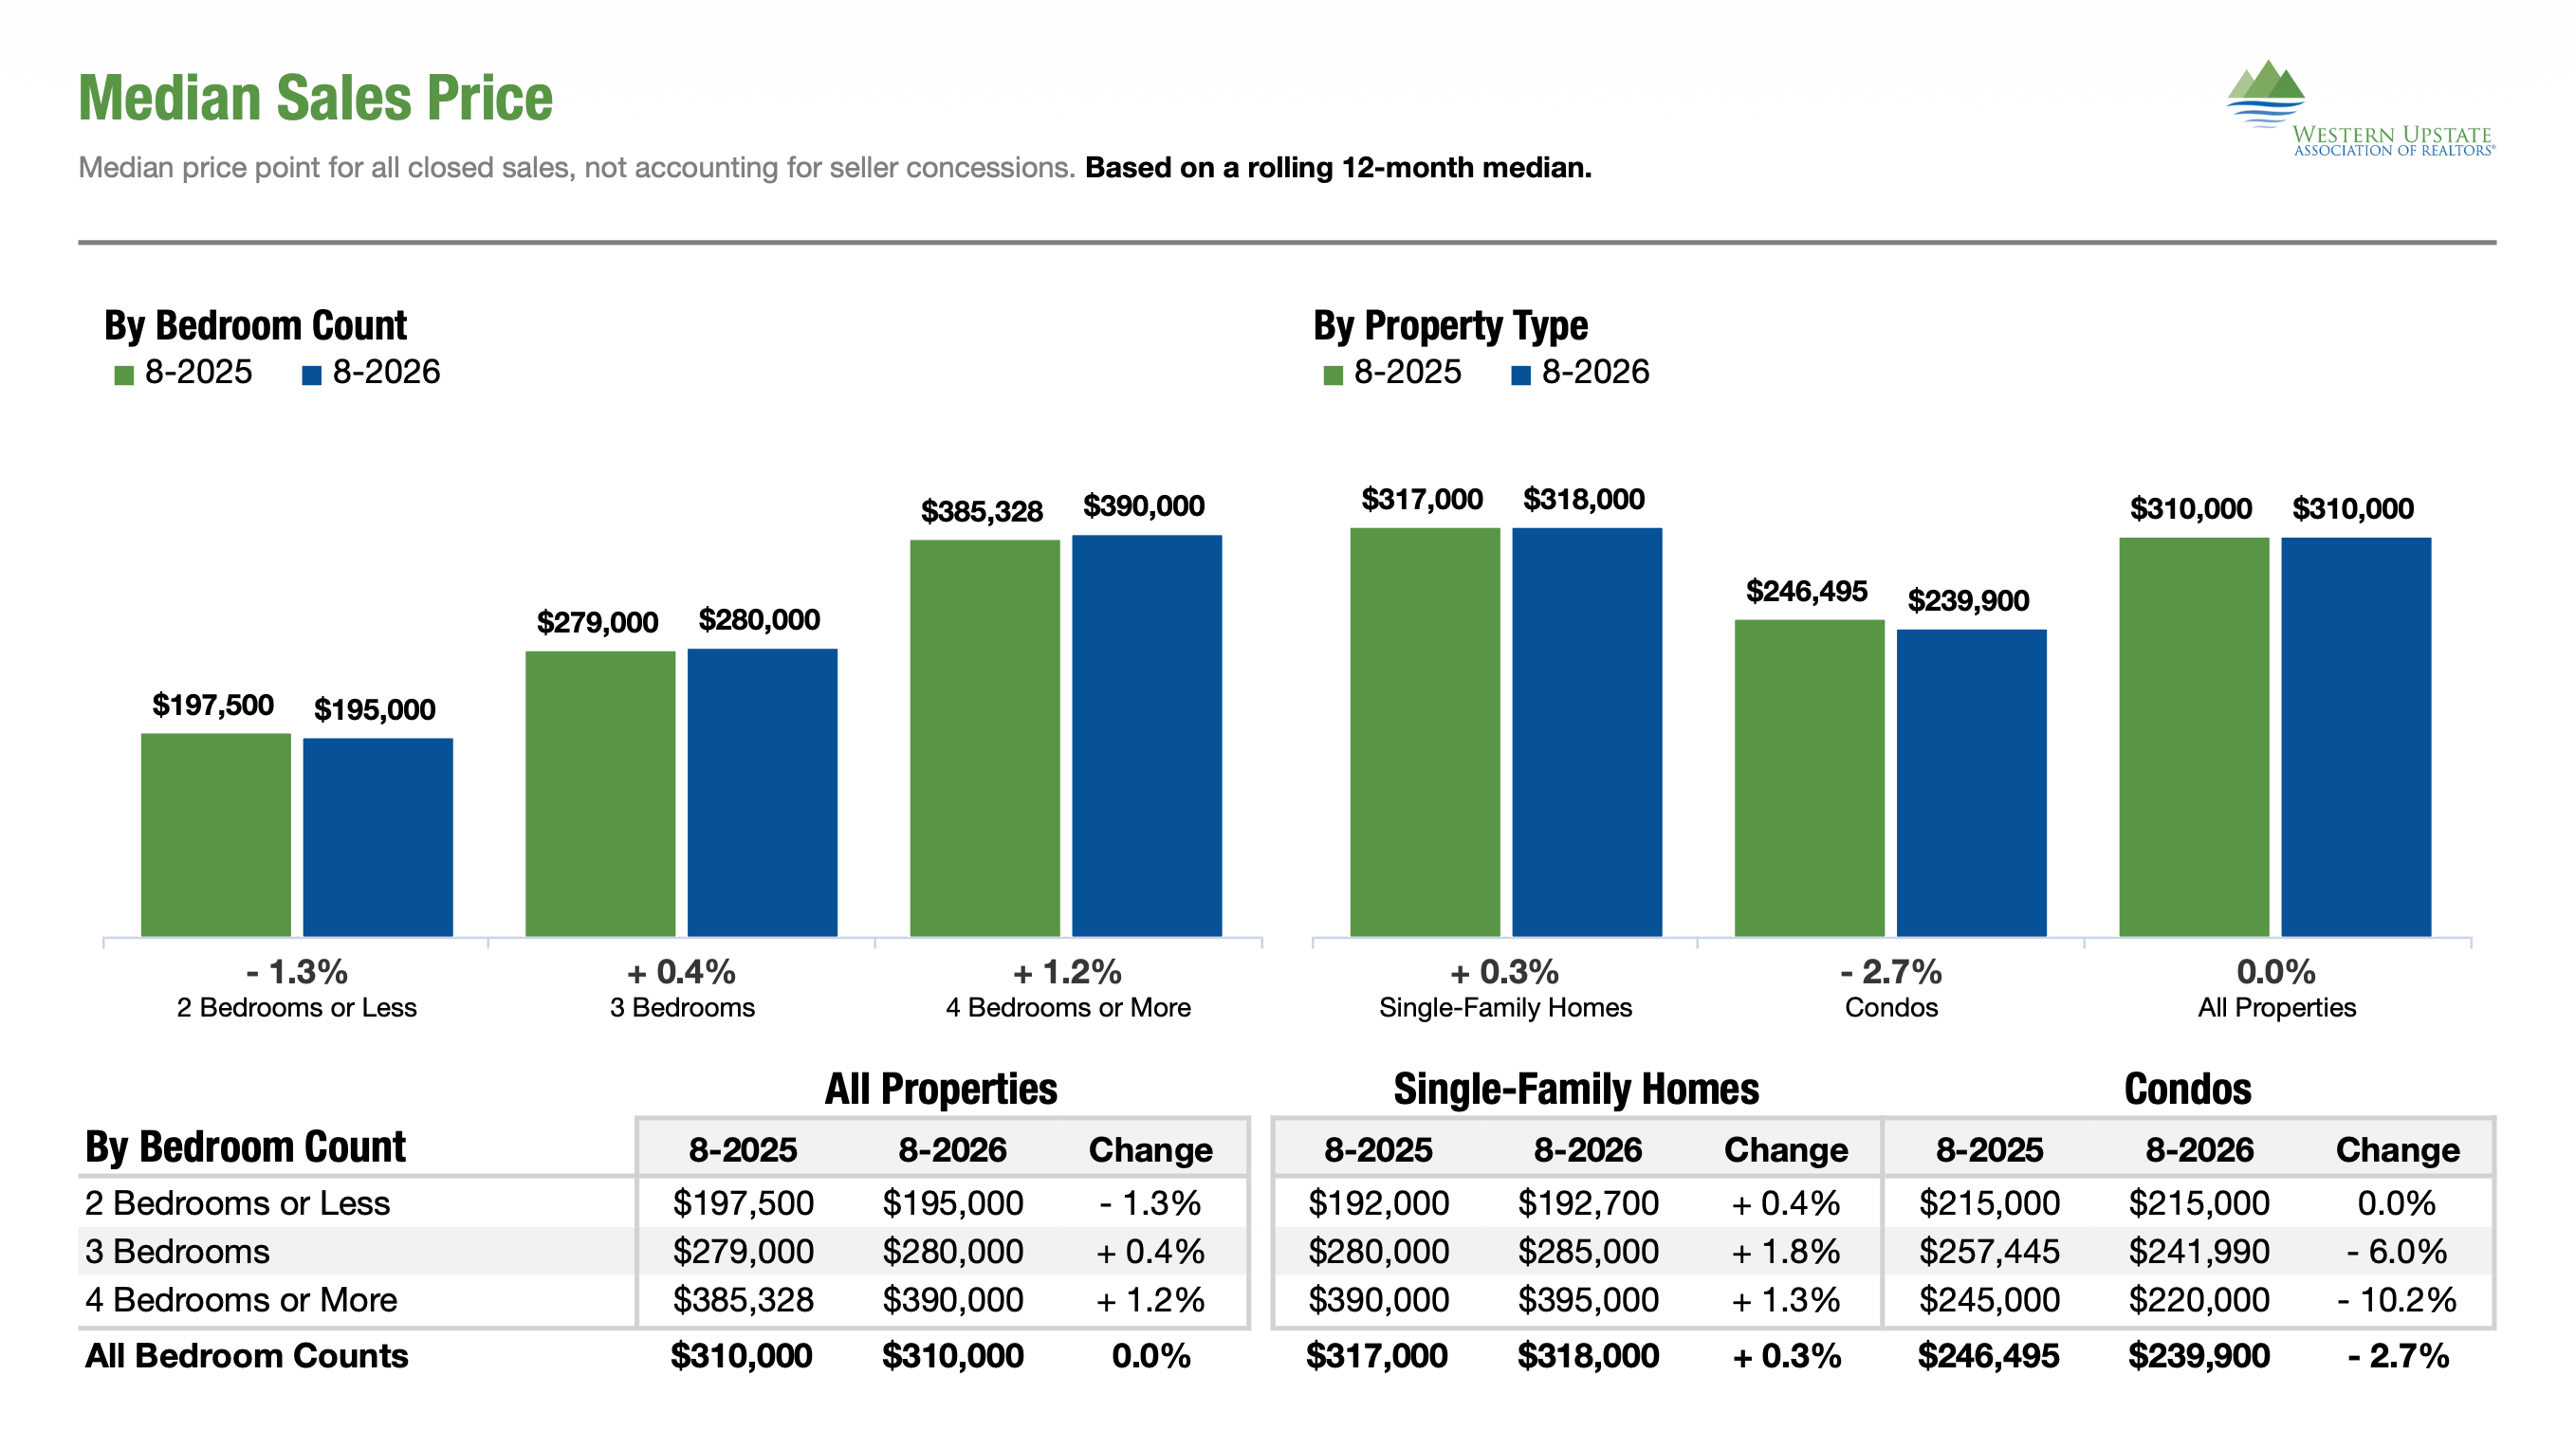
Median Sales Price, WUMLS
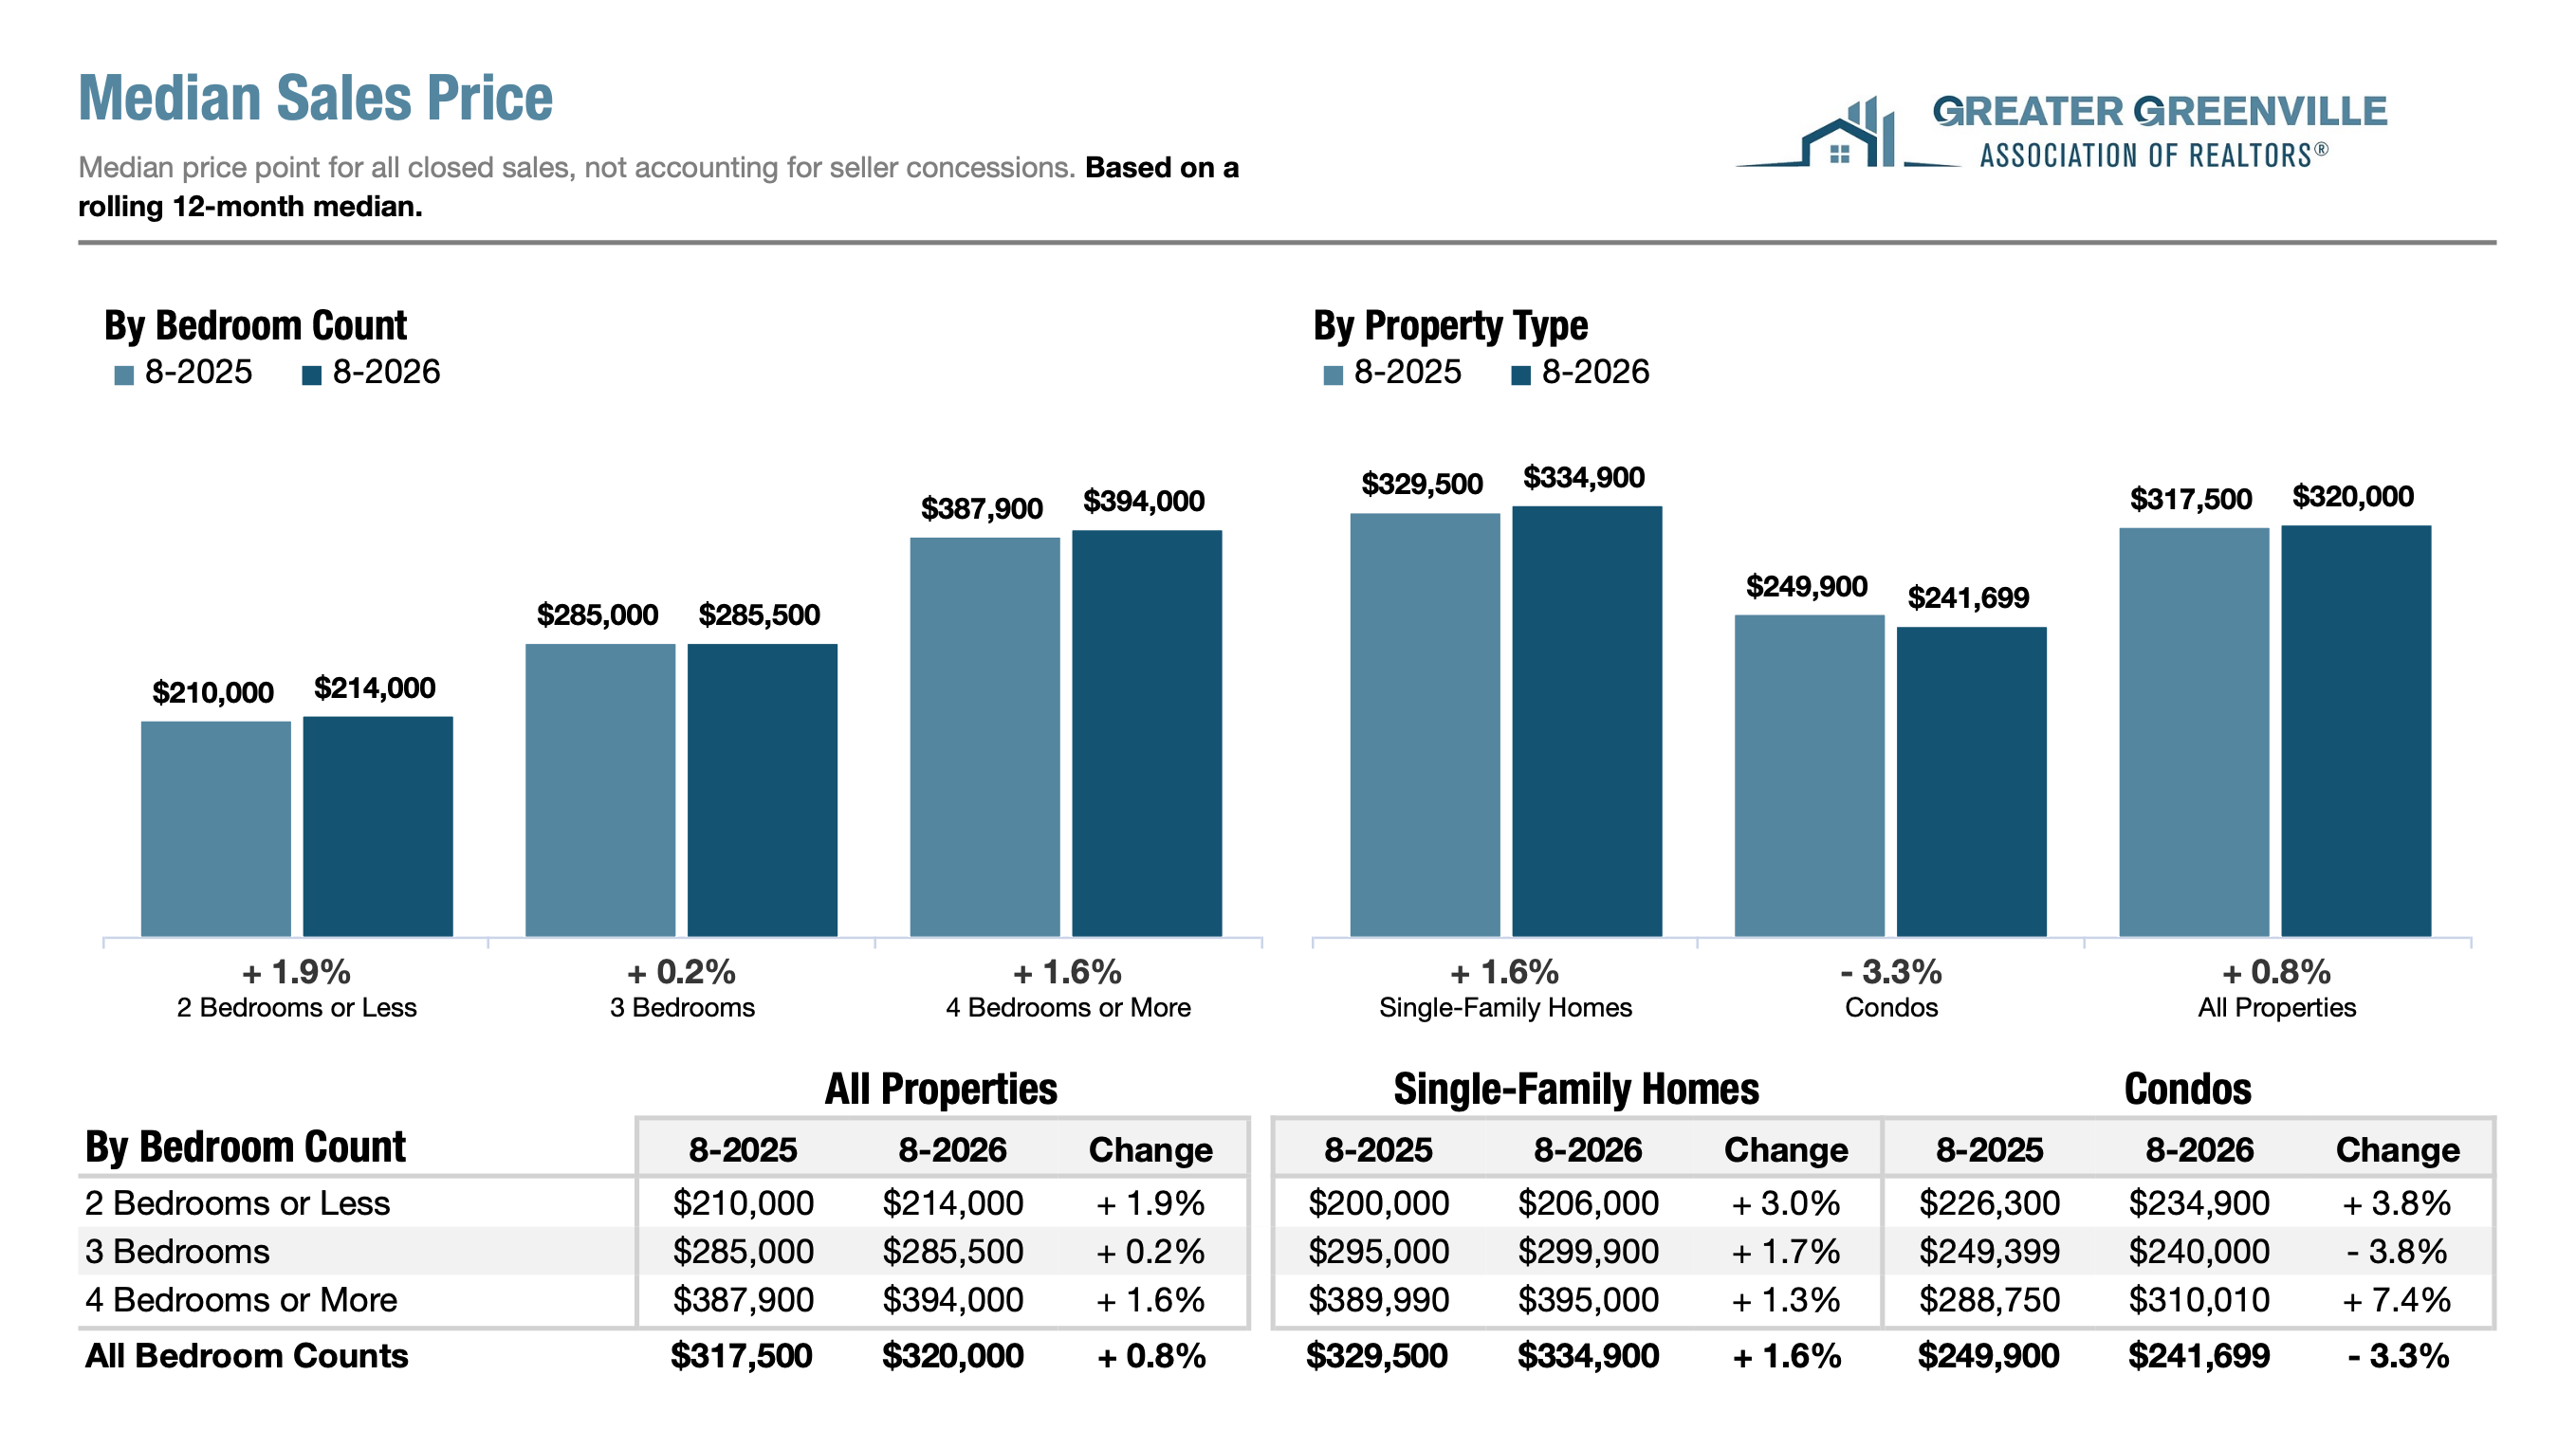
Median Sales Price, GGAR
Demand Has Not Disappeared
Looking beyond a single month reveals another important part of the story.
For the 12 month period ending in August, pending sales in Greater Greenville increased 5.7% overall. Activity in the $1,000,001 and above segment increased 25.3%, the strongest gain among the report's price ranges.
Spartanburg's rolling 12 month pending sales increased 3.2%, with the $500,001 to $750,000 segment increasing 16.9%.
Western Upstate presents a different picture. Rolling 12 month pending sales declined 1.7% overall, although the $750,001 to $1 million segment recorded a 2.3% increase.
This is another reason the current market is difficult to summarize with a single headline. Demand remains present, and in some segments it has grown considerably, but that demand is not distributed evenly across the region or across price points.
The result is a more segmented market in which broad regional statistics provide context, but individual price ranges and communities can behave very differently.
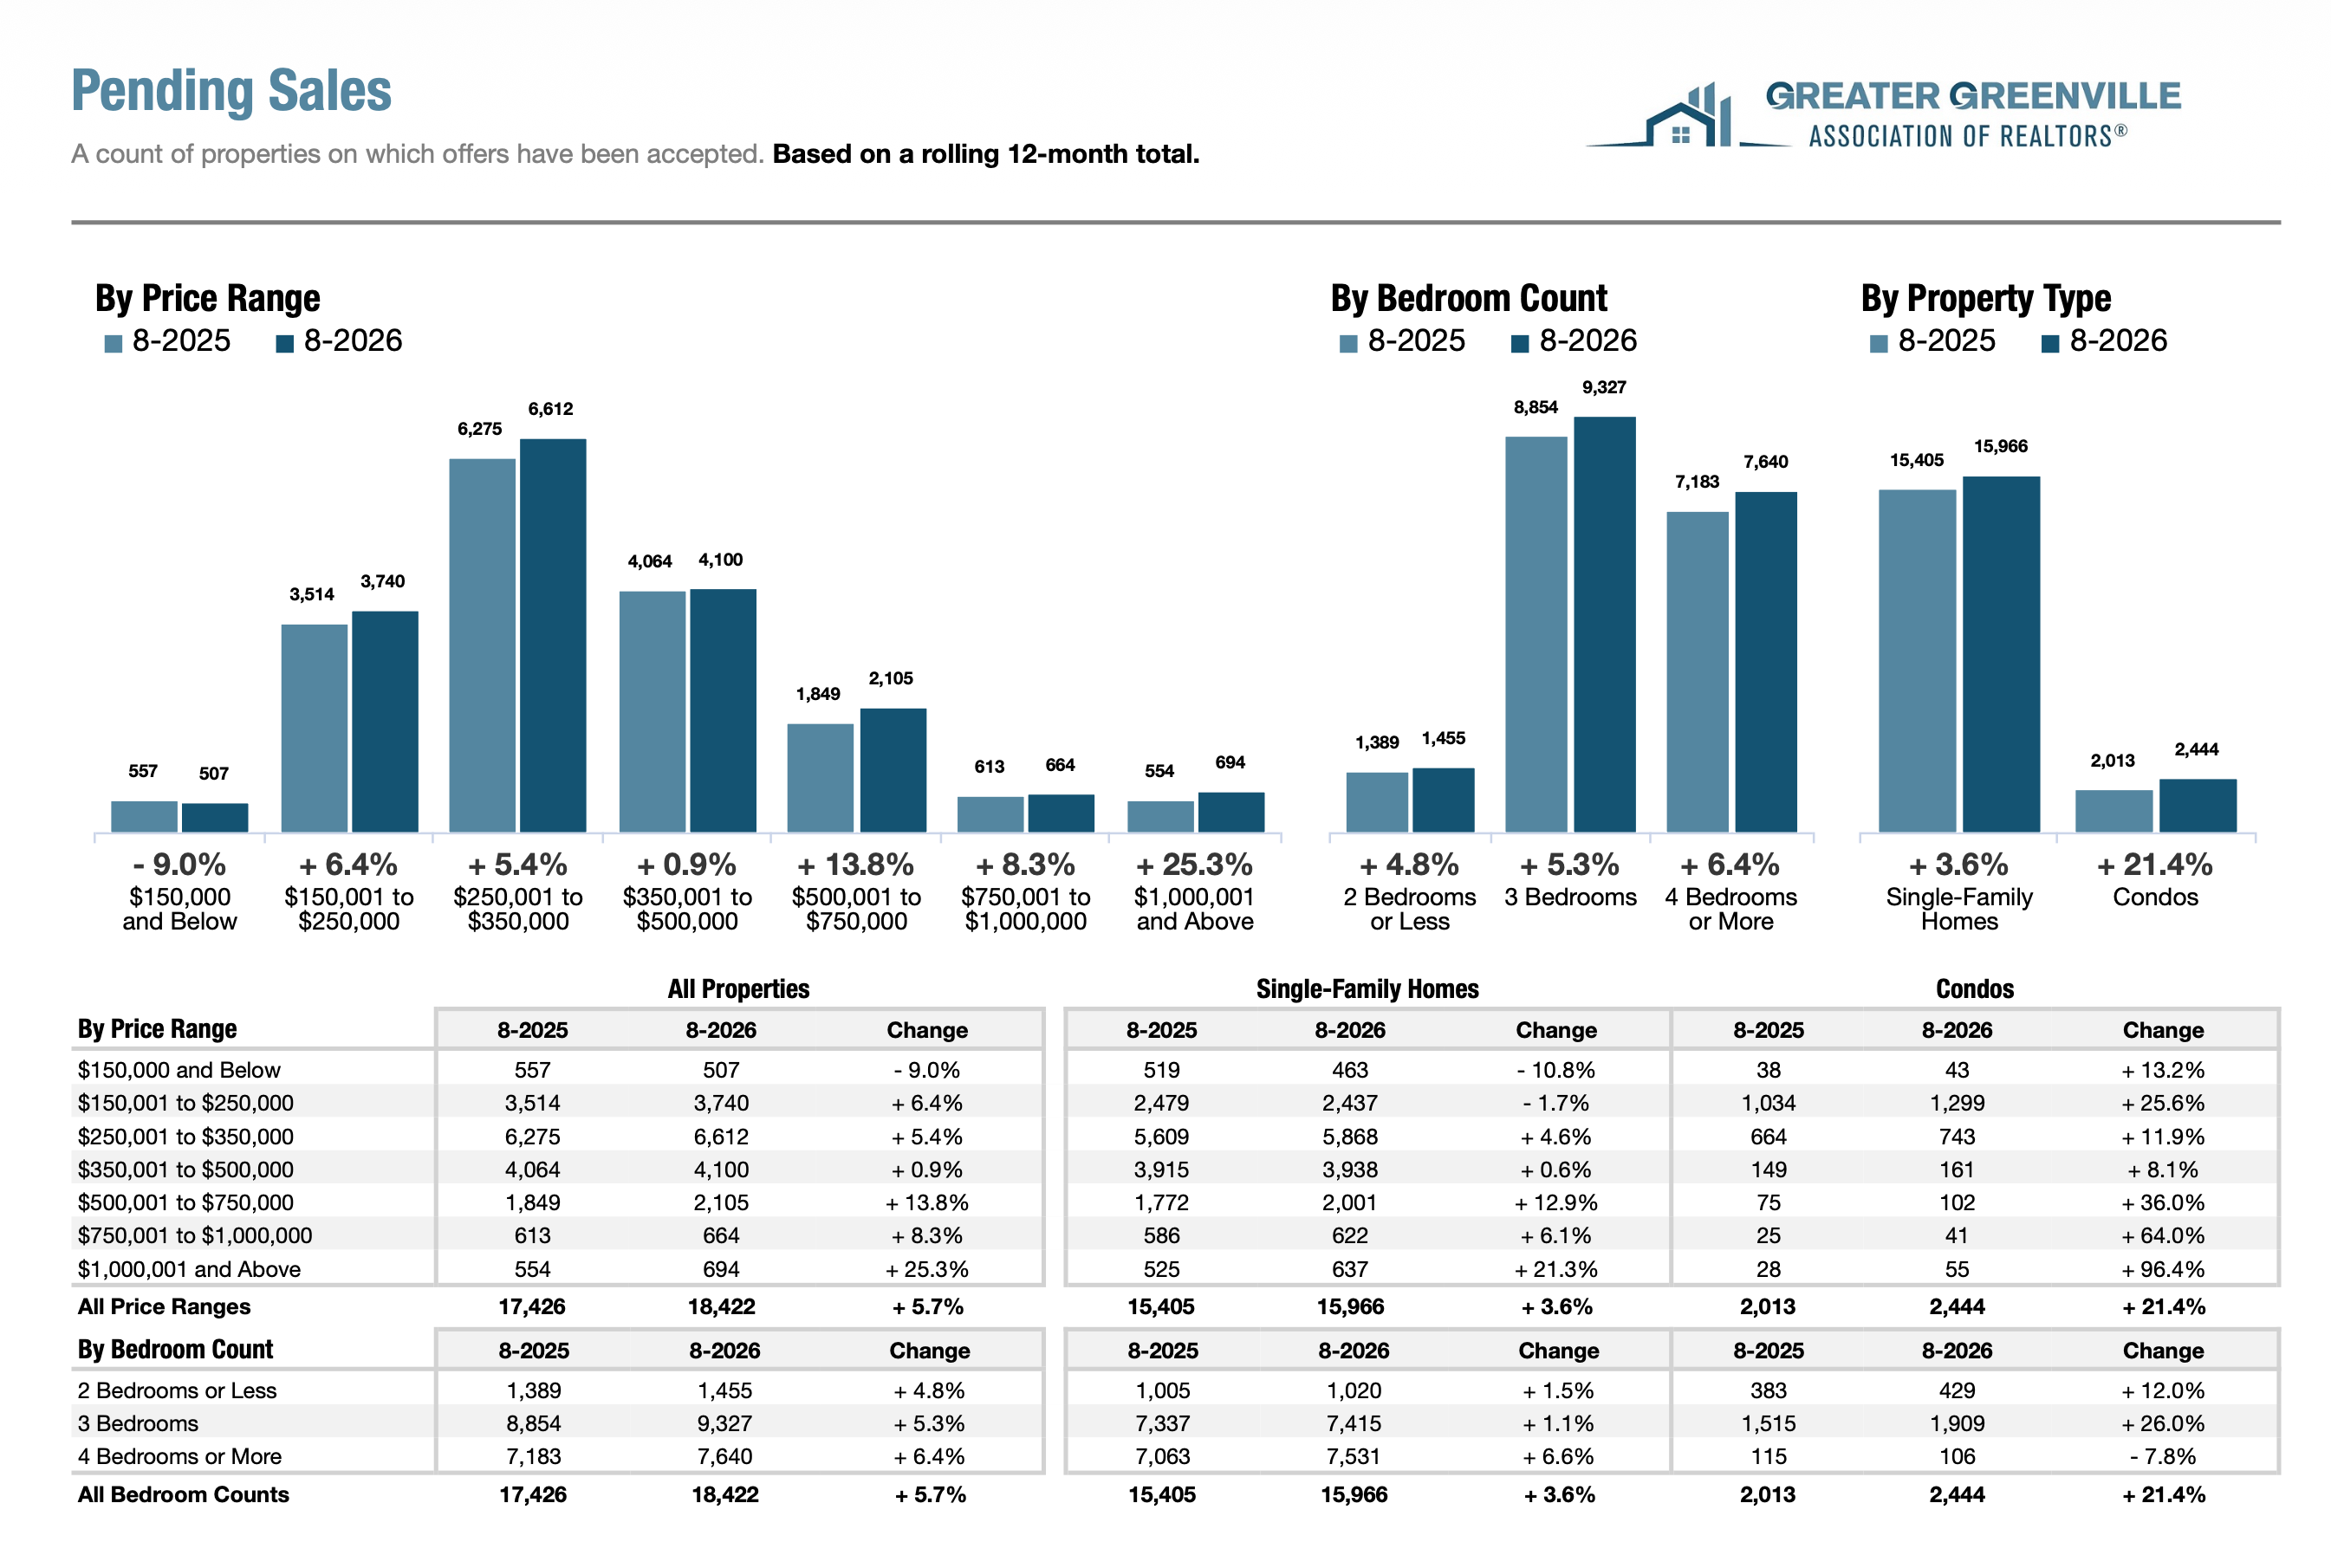
Pending Sales by Price Range, GGAR
Greater Greenville, Spartanburg, and the Western Upstate Are Moving at Different Speeds
August makes the regional differences increasingly difficult to overlook.
Greater Greenville currently has the strongest combination of sales activity and underlying demand among the three markets. Inventory is higher and homes are taking longer to sell, but closed sales remain ahead of last year both for August and year to date, while rolling pending activity is also positive.
Spartanburg is showing more moderation. Sales and median pricing were lower than last August, and marketing times have increased substantially. At the same time, year to date pending activity remains slightly positive and rolling 12 month pending sales are higher, suggesting continued buyer demand beneath a slower monthly pace.
The Western Upstate is experiencing the clearest shift toward greater supply and slower absorption. Inventory has increased by more than one third, months supply is approaching six months, and both monthly and year to date sales activity have softened. Pricing, however, has remained comparatively resilient, underscoring that changing supply and sales conditions do not always translate immediately into lower values.
The statewide August statistics reinforce the difference: closed sales were up 0.9% year over year in Greater Greenville, down 4.5% in Spartanburg, and down 15.8% in the Western Upstate.
What This Means for Buyers and Sellers
For buyers, today's market generally offers more time and more choice than the conditions many became accustomed to over the past several years. That does not mean every property comes with significant negotiating room. Well positioned homes and certain price segments continue to attract demand. But greater supply can give buyers more opportunity to compare properties carefully and make decisions based on value rather than scarcity alone.
For sellers, the market increasingly rewards preparation and realistic positioning. Longer marketing times and greater competition mean pricing a property correctly from the outset has become more important. The continued strength in portions of the market also demonstrates that buyers are still willing to act when a property aligns with their expectations.
Most importantly, the August data reinforces why broad descriptions of the Upstate market have become less useful. Conditions in Greater Greenville are not identical to Spartanburg, and neither mirrors what is happening across the Western Upstate. Even within those markets, price point and property type can materially change the picture.
Looking Ahead
August does not point to a market moving uniformly in one direction.
Greater inventory and longer marketing times are giving buyers more influence than they had when supply was exceptionally limited. At the same time, Greater Greenville continues to record positive year to date sales growth, portions of the upper end remain active, and pricing across the region has proven more resilient than declining sales figures alone might imply.
There are also legitimate areas of softness. Spartanburg's pace has moderated, and the combination of rapidly expanding inventory and declining sales in the Western Upstate deserves attention in the months ahead.
National conditions provide another headwind. Existing home sales declined 2.0% nationally in August while inventory increased 5.9% from a year earlier. The average 30 year fixed mortgage rate was 6.67% during the month, continuing to place pressure on affordability and purchasing power.
For the Upstate, the question heading into fall is therefore less about whether the market is simply strengthening or weakening and more about how effectively individual markets absorb the additional homes available for sale.
That is the measure we will be watching closely in the months ahead.
Data Sources & Methodology
Market statistics are drawn from August 2026 reports from the Greater Greenville Association of REALTORS® Multiple Listing Service, Spartanburg Association of REALTORS® Multiple Listing Service, Western Upstate Association of REALTORS® Multiple Listing Service, and South Carolina REALTORS®. The MLS reports are current as of September 10, 2026.
Market statistics represent broad market conditions and may vary considerably by community, property type, and price point.
More from Blackstream