The Upstate South Carolina housing market entered the final quarter of 2026 with more homes available for sale, longer marketing times, and a noticeable moderation in October sales activity. Yet beneath those broader trends, the market continues to demonstrate meaningful differences across Greater Greenville, Spartanburg, and the Western Upstate.
While October brought fewer closed sales in Greater Greenville and the Western Upstate compared to the same month last year, year-to-date activity tells a more balanced story. Pricing has also remained relatively resilient in some markets, while demand for properties above $1 million continues to stand out.
Taken together, these trends suggest a market increasingly shaped by location, price point, and individual property positioning rather than a single regional direction.
More Inventory Is Giving Buyers Greater Choice
One of the most consistent developments across the Upstate this year has been the expansion of available inventory.
In October, Greater Greenville reported 6,766 homes for sale, an increase of 10.4% from a year earlier. Spartanburg inventory rose 4.7% to 2,527 homes, while the Western Upstate experienced a more substantial 24.4% increase, reaching 2,887 available properties.
The difference is especially notable in the Western Upstate, where months of inventory increased from 4.3 to 5.5 year over year. Greater Greenville and Spartanburg each reported 4.5 months of supply.
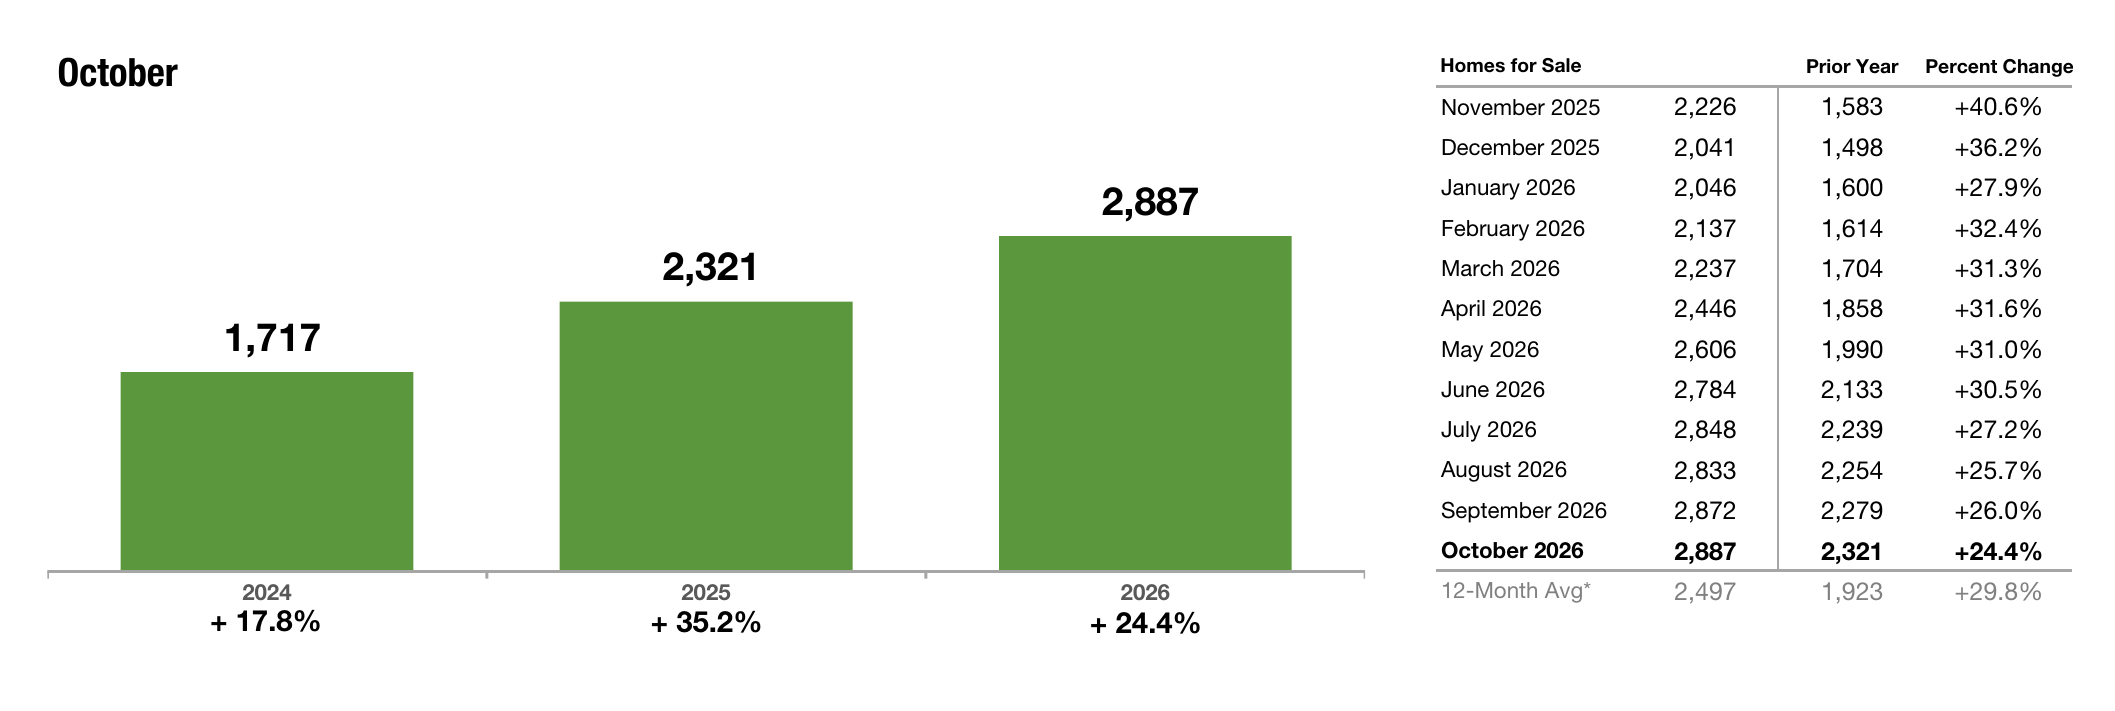
Inventory of Homes for Sale
For buyers, this broader selection creates opportunities to compare properties more carefully and consider options that may have moved quickly in previous market conditions. For sellers, increased competition makes thoughtful pricing, presentation, and positioning increasingly important.
More inventory does not necessarily indicate weaker demand. Rather, it changes the competitive environment in which individual properties are introduced to the market.
October Activity Slowed, but the Broader Picture Remains More Balanced
October brought a notable decline in closed sales across two of the Upstate's three primary MLS markets.
Greater Greenville recorded 1,278 closed sales, down 12.1% from October 2025, while the Western Upstate reported 462 closings, a 13.2% decline. Spartanburg moved in the opposite direction, recording 520 closed sales, an increase of 3.6%.
Pending sales declined year over year in all three markets, suggesting some moderation in buyer activity heading into the final months of the year.
However, year-to-date figures offer important context. Greater Greenville's closed sales remain 2.1% ahead of the same period in 2025, while Spartanburg is nearly unchanged at a 0.4% decline. The Western Upstate has experienced a more pronounced decrease, with year-to-date closings down 6.2%.
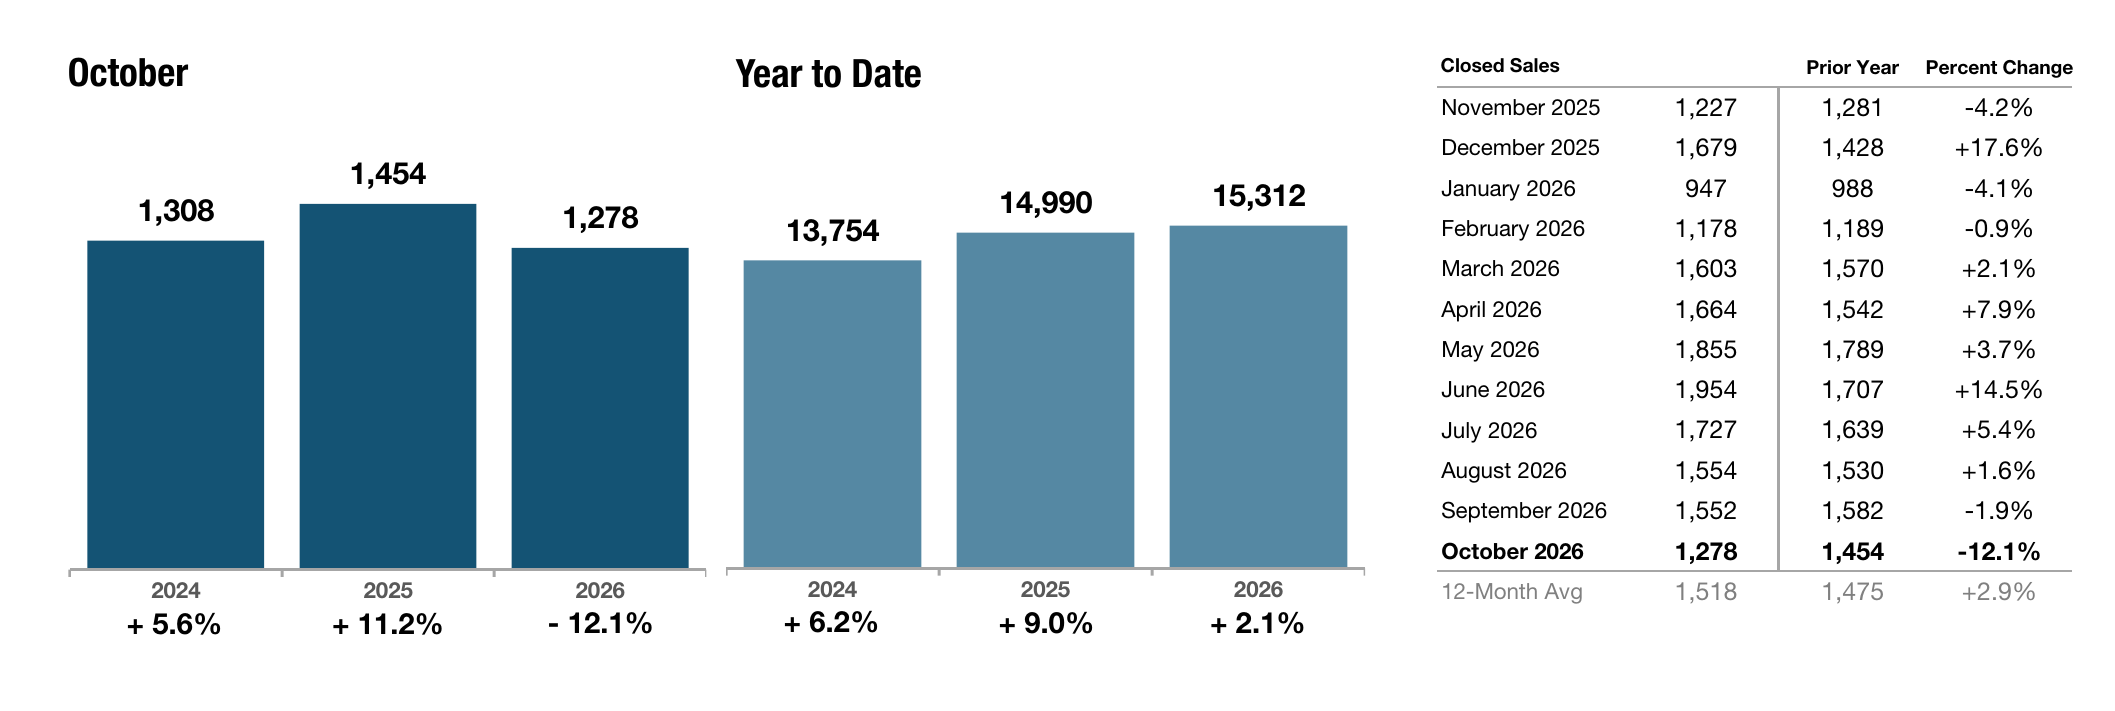
Closed Sales
These distinctions matter. A slower individual month does not necessarily define the direction of an entire year, and the pace of activity continues to vary considerably across the region.
Homes Are Taking Longer to Sell, but Not at the Same Rate
Longer marketing times have become another defining characteristic of the Upstate housing market.
Greater Greenville properties averaged 60 days on market in October, an increase of 9.1% from a year earlier. Spartanburg saw a considerably larger change, with average marketing time rising 34.8% to 62 days. In the Western Upstate, homes averaged 77 days on market, an increase of 2.7%.
The year-to-date comparison reinforces this shift. Average days on market increased 11.5% in Greater Greenville, 46.5% in Spartanburg, and 18.8% in the Western Upstate.
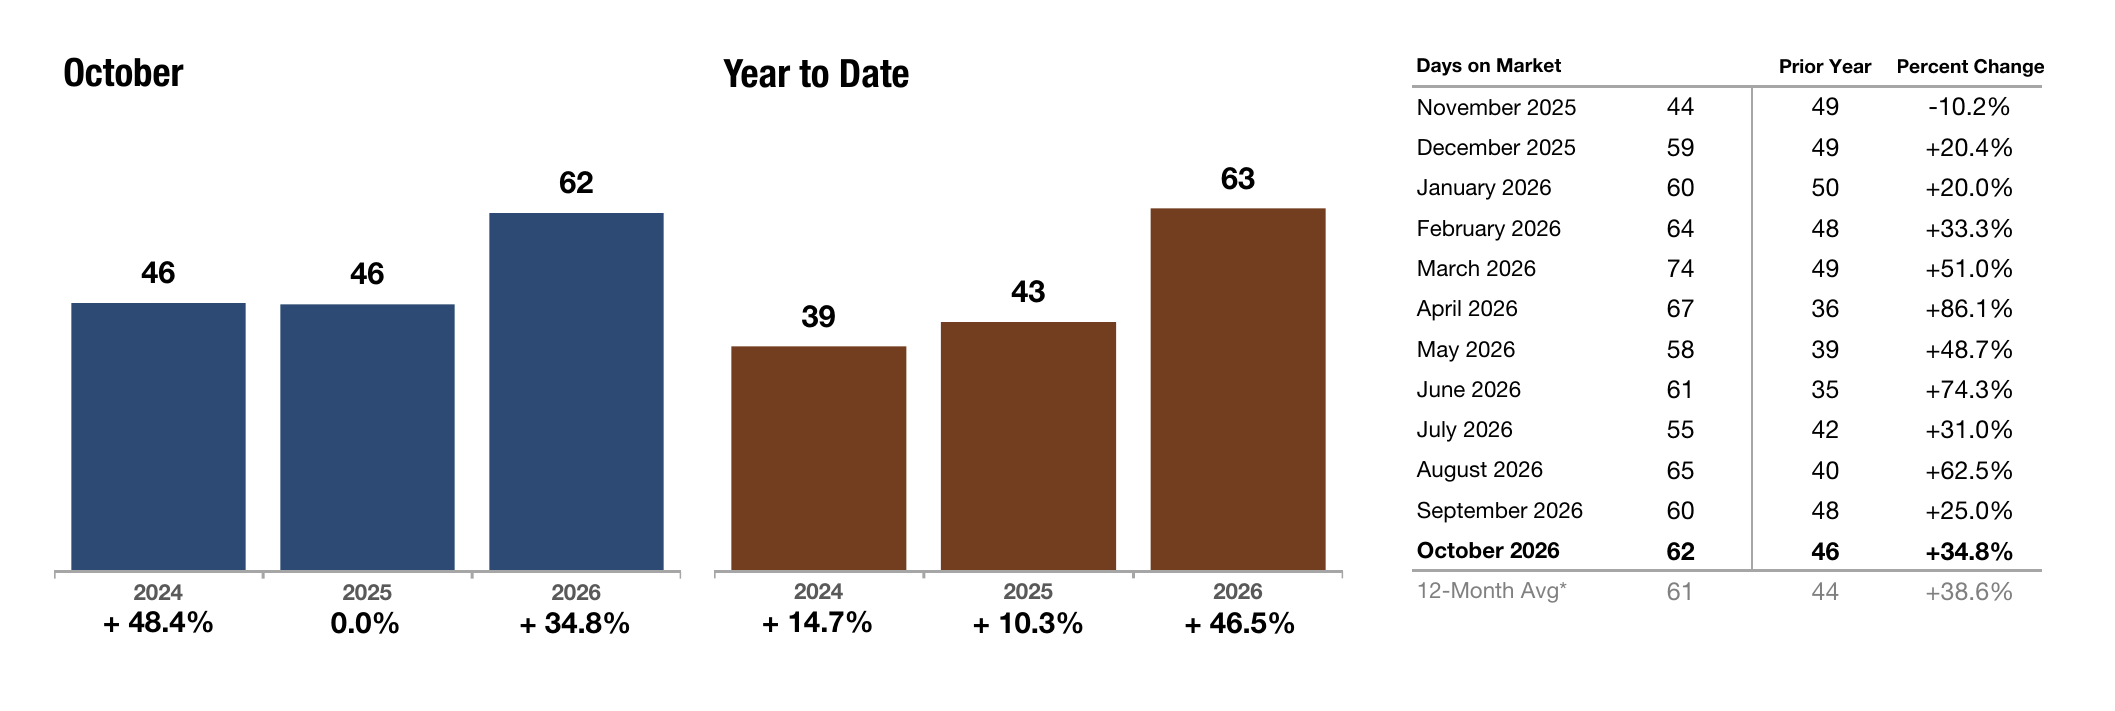
Days on Market Until Sale
These changes suggest that buyers are approaching decisions with greater consideration, particularly as the number of available alternatives expands.
For sellers, the implication is not simply that a home may require more time to sell. It is that initial pricing, property condition, marketing quality, and the surrounding competitive inventory can have a greater influence on how quickly a property attracts an offer.
Pricing Trends Reveal Three Different Market Conditions
Despite increased inventory and longer marketing times, pricing has not moved uniformly downward.
Greater Greenville’s median sales price reached $327,200 in October, an increase of 1.3% year over year. The Western Upstate reported a median price of $332,500, up 6.8%, while Spartanburg’s median declined 3.7% to $287,000.
Average sales prices presented a somewhat different picture. Greater Greenville averaged $414,724, nearly unchanged from October 2025. Spartanburg averaged $329,159, also relatively stable, while the Western Upstate’s average declined 2.6% to $455,593.
These differences underscore the importance of considering both median and average pricing, as well as the types of properties represented in a given month’s transactions.
The broader year-to-date figures provide additional perspective. Median prices are up 0.6% in Greater Greenville, down 1.4% in Spartanburg, and unchanged in the Western Upstate.
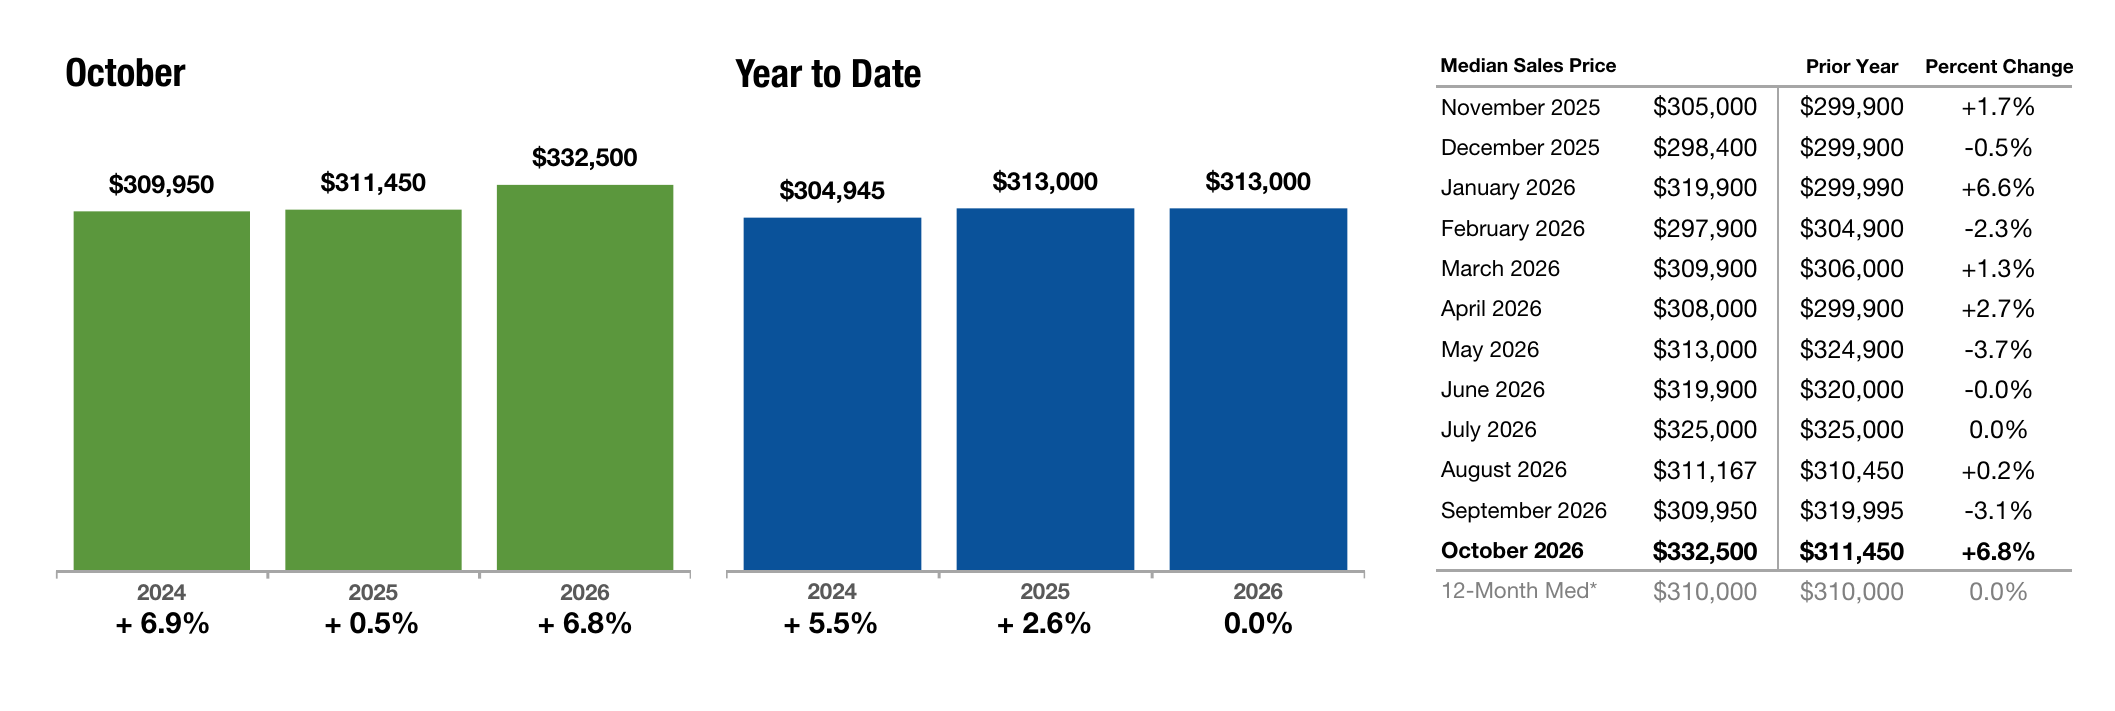
Median Sales Price
Rather than signaling a uniform correction, the data points toward a market where pricing outcomes depend increasingly on local conditions and the composition of available and recently sold properties.
Higher Price Points Continue to Demonstrate Demand
One of the more notable trends in the October data appears in the upper end of the market.
According to the Greater Greenville Association of REALTORS® Housing Supply Overview, pending sales of properties priced above $1 million increased 16.2% over the rolling 12-month period ending in October 2026.
That represents a stronger increase than any other price range in the report. Closed sales above $1 million also increased 13.3% over the same rolling period.
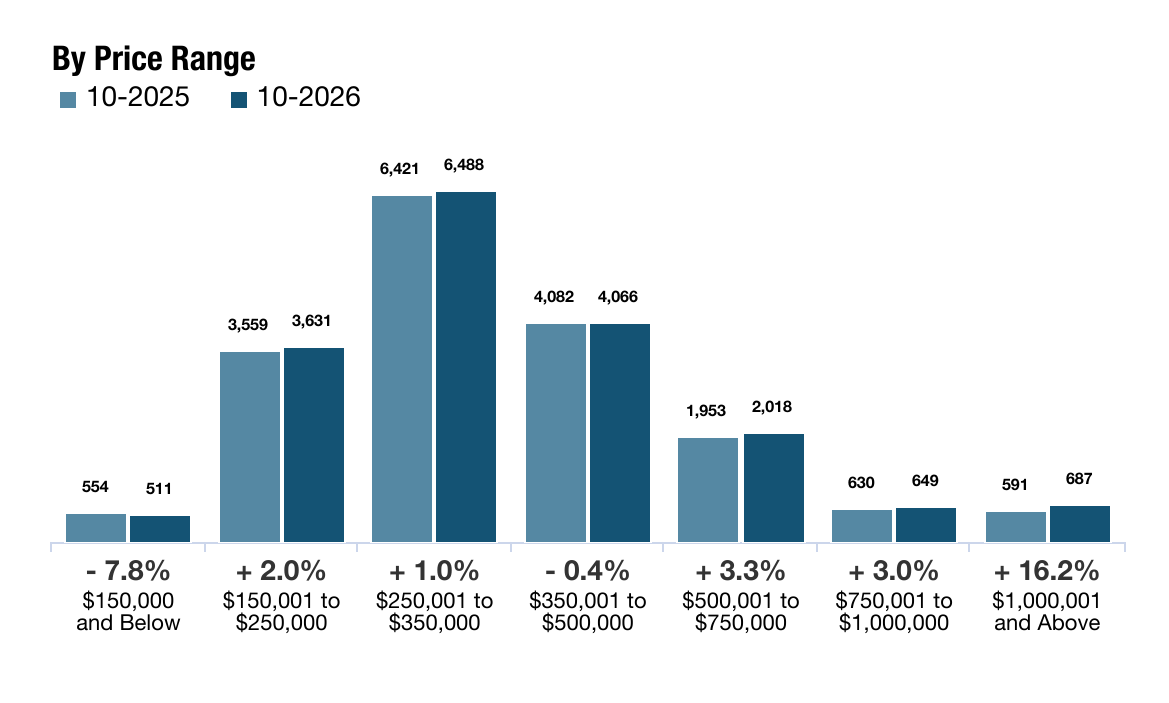
Pending Sales by Price Range
This distinction is particularly meaningful when considered alongside October’s broader moderation in transaction activity.
It suggests that demand for higher-priced properties continues to contribute to the region’s overall market performance, even as buyers in other segments may be approaching purchasing decisions more cautiously.
The upper end is not insulated from changing market conditions, and individual properties still face competition. However, the sustained activity in this price range reinforces the importance of evaluating luxury and upper-tier real estate within its own market context rather than relying exclusively on regional averages.
Three Markets, Three Different Stories
Although Greater Greenville, Spartanburg, and the Western Upstate share broader economic and geographic connections, October’s results illustrate why each requires a more localized interpretation.
Greater Greenville continues to demonstrate relatively stable pricing and positive year-to-date sales activity, even as October closings declined and inventory expanded. With more homes available and longer marketing times, the market appears increasingly selective rather than uniformly weaker.
Spartanburg experienced the most substantial year-over-year increase in days on market among the three markets, alongside a decline in median pricing. Yet October closed sales increased, illustrating the distinction between transaction volume and the conditions influencing individual listings.
The Western Upstate experienced the largest increase in available inventory and the highest months of supply. While October and year-to-date closed sales declined, median pricing increased year over year, suggesting a market where supply, transaction activity, and pricing are not moving in the same direction.
These differences reinforce an essential consideration for buyers and sellers: regional trends establish context, but the conditions surrounding a specific property are often considerably more relevant to an individual real estate decision.
What This Means for Buyers and Sellers
For buyers, the expansion of available inventory creates an opportunity to evaluate a broader range of properties and make more considered decisions. Longer marketing times may provide additional flexibility, although well-positioned homes and desirable properties can still attract meaningful competition.
For sellers, the market increasingly rewards preparation and precision. Understanding competing inventory, recent sales, pricing trends, and buyer expectations is essential when developing a strategy that reflects current conditions rather than those of previous years.
Across both sides of a transaction, the value of informed local market knowledge becomes more apparent as conditions diverge.
Looking Ahead
As the Upstate moves toward the close of 2026, the relationship between inventory, buyer activity, and pricing will remain particularly important to watch.
The continued availability of more homes may support a more deliberate purchasing environment, while changes in pending sales will help indicate whether October’s moderation represents a seasonal adjustment or a more sustained shift.
At the same time, the resilience of higher price points and the differences emerging between individual markets suggest that the coming months are unlikely to produce a single, uniform story across the region.
For buyers and sellers alike, understanding those distinctions will remain central to navigating the Upstate real estate market with clarity and confidence.
Data Sources & Methodology
This report draws on October 2026 Monthly Indicators and Housing Supply Overview reports from the Greater Greenville Association of REALTORS®, Spartanburg Association of REALTORS®, and Western Upstate Association of REALTORS®, provided by South Carolina REALTORS® and ShowingTime Plus.
Monthly comparisons reflect October 2026 versus October 2025 unless otherwise noted. Year-to-date comparisons cover January through October, while Housing Supply Overview statistics referenced in the report reflect rolling 12-month periods ending in October 2026.
MLS geographic coverage may overlap, and market totals should not be added together as though they represent distinct, nonoverlapping territories. Market statistics describe broader trends and may not reflect conditions surrounding an individual property.
More from Blackstream