The Upstate housing market entered fall with more homes available than a year earlier, longer marketing times and a less consistent pace of sales. The direction of pricing, however, varied across Greater Greenville, Spartanburg and Western Upstate, making a single description of the region less useful than a closer look at its individual markets.
September closed sales declined year over year in all three MLS regions. Greater Greenville recorded 1,547 closings, down 2.2%; Spartanburg recorded 559, down 9.0%; and Western Upstate recorded 550, down 7.4%. Yet their year-to-date positions differ: Greenville remained ahead of 2025, while Spartanburg and Western Upstate were behind.
Taken together, the reports describe a market in which buyers have more alternatives, but demand has not moved uniformly across locations or price ranges. For sellers, the broader selection places greater emphasis on a clear market position. For buyers, it creates an opportunity to compare more carefully without assuming that every property offers the same room for negotiation.
More Inventory Is Changing the Competitive Landscape
All three regions ended September with more active listings than a year earlier. Greater Greenville reported 6,639 homes for sale, up 9.2%; Spartanburg reported 2,609, up 9.7%; and Western Upstate reported 2,997, up 31.5%. The scale of the increase is particularly notable in Western Upstate, where the available selection has expanded considerably faster than in the other two regions.
The August-to-September comparison adds an important distinction. Greenville inventory edged down 0.7% from 6,685 homes, while Spartanburg inventory increased 3.1% from 2,530 and Western Upstate inventory increased 5.2% from 2,849. More inventory than a year ago does not mean inventory is continuing to rise at the same pace in every market.
Months supply reflects the same uneven balance. Greenville held at 4.4 months from August, Spartanburg increased from 4.4 to 4.6 months, and Western Upstate increased from 5.4 to 5.8 months. Compared with September 2025, supply increased in all three regions. These figures relate available inventory to the preceding 12 months of pending-sales activity, providing context beyond the listing count alone.
For sellers, the expanding field of alternatives makes competing listings increasingly relevant to pricing and presentation. For buyers, the opportunity is broader choice, although the degree of competition still depends on the specific location, condition and price range.
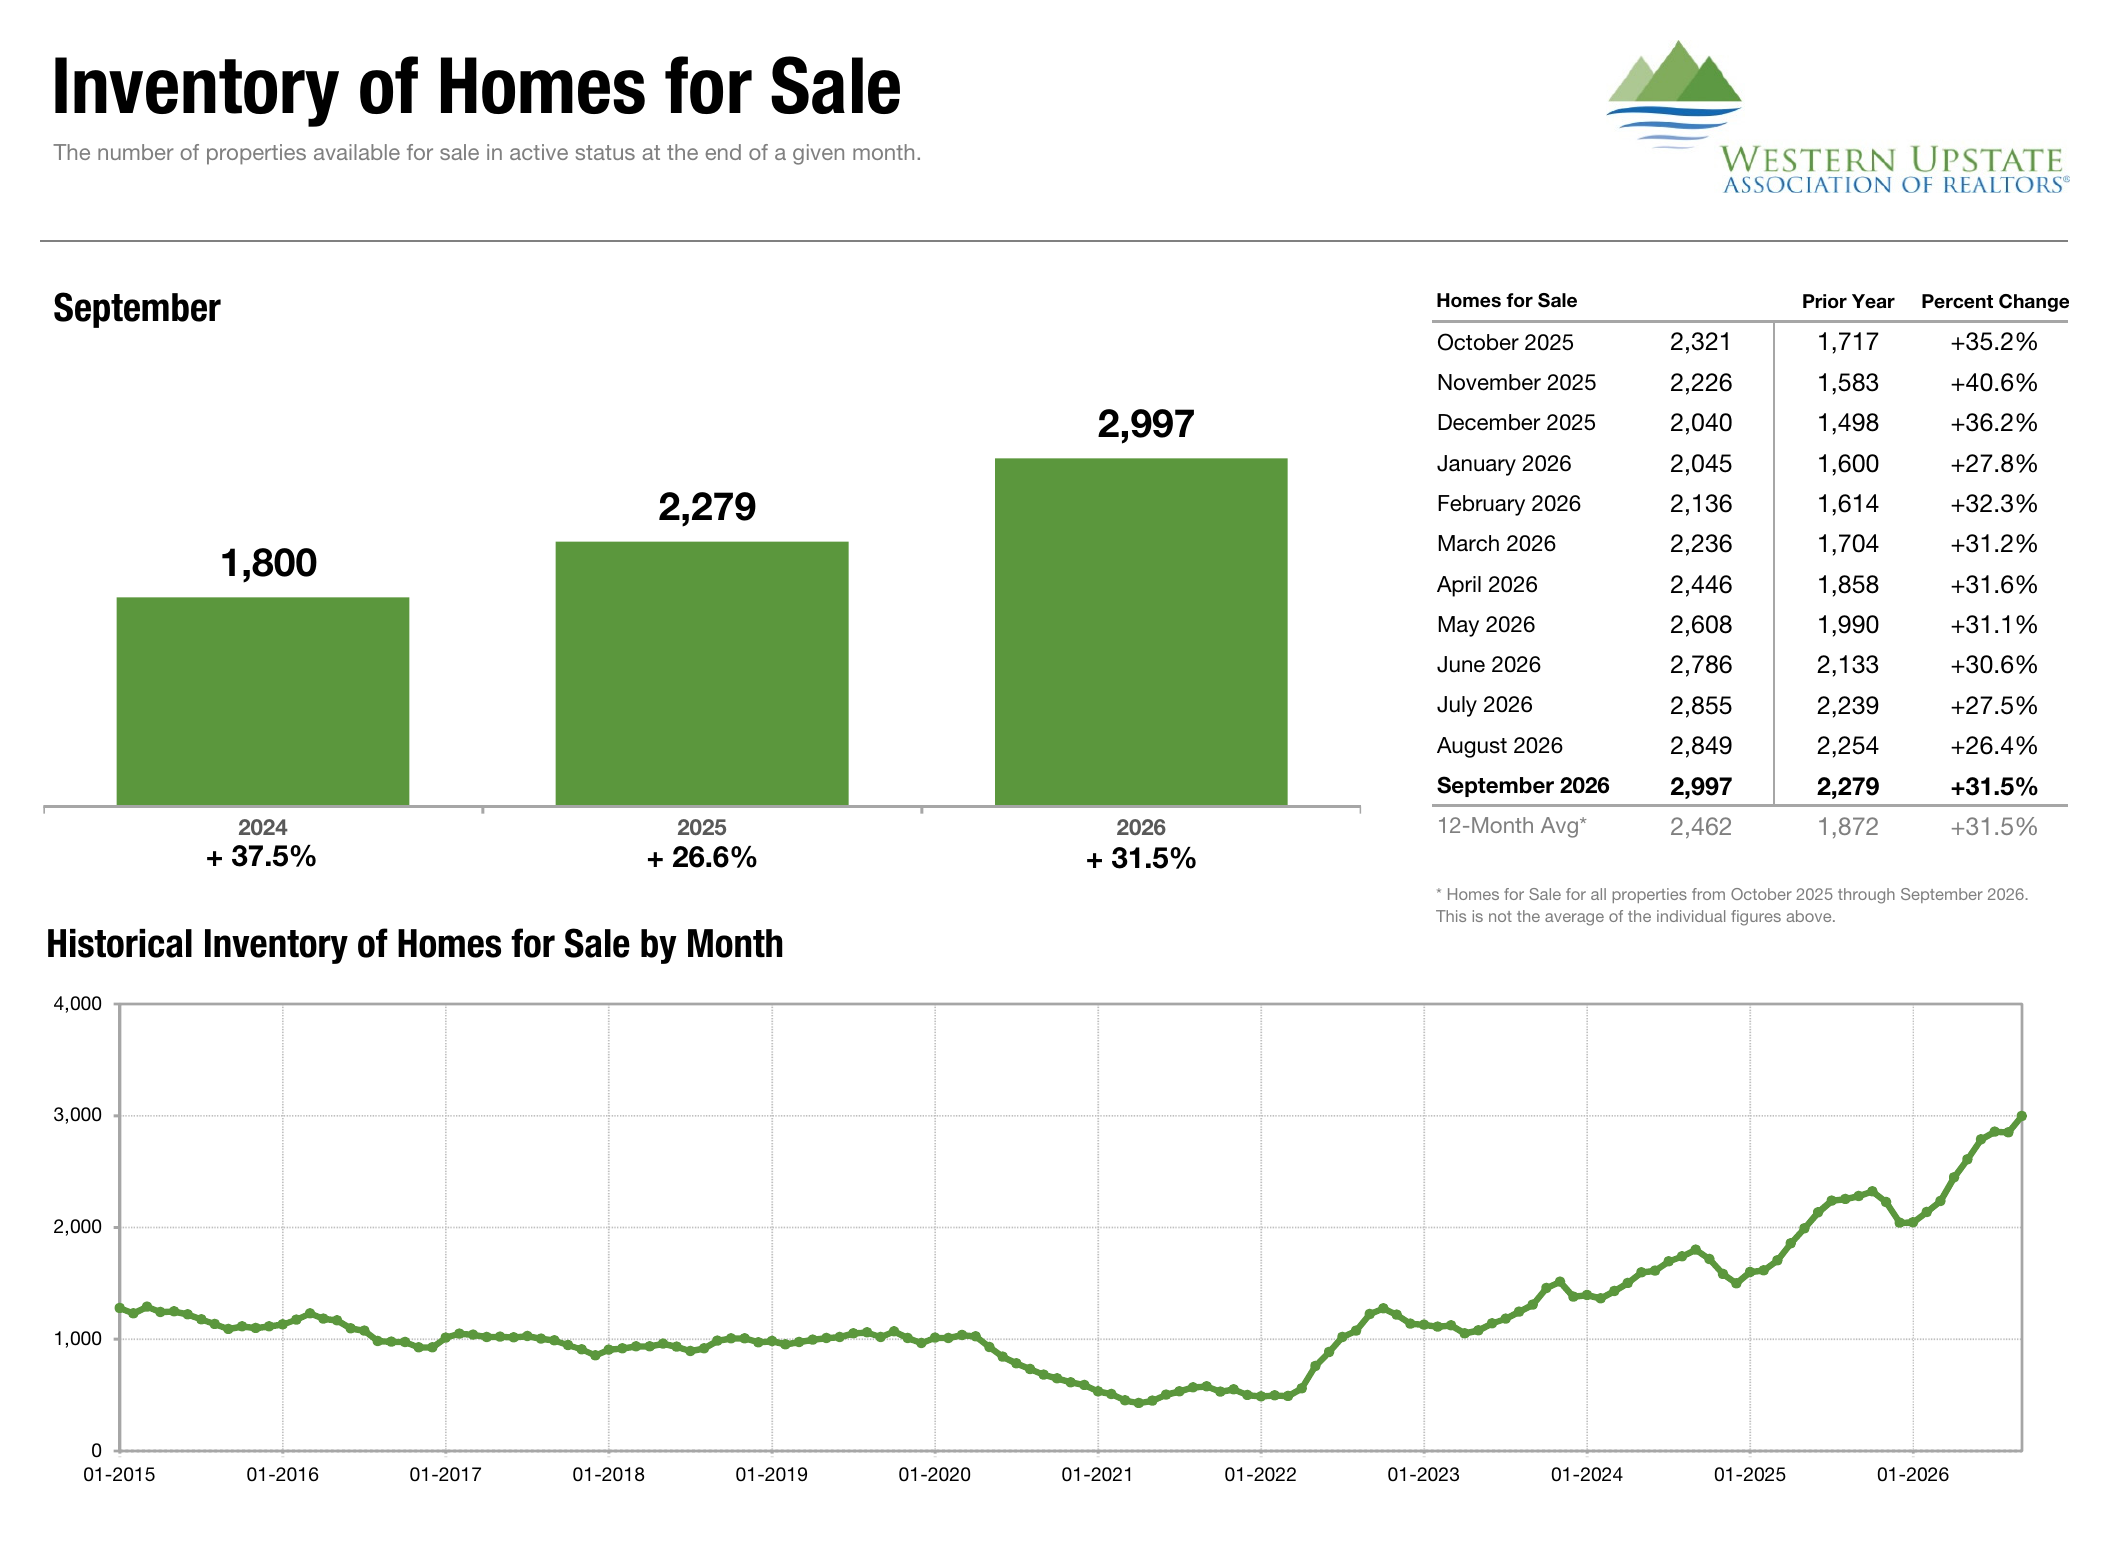
Inventory of Homes for Sale, September 2026, WUMLS
Contract Activity Is Softer Than the Closing Headlines Alone Suggest
Pending sales offer one of September’s clearest indications that the pace of new activity has become more restrained. Greenville recorded 1,396 accepted contracts, down 4.1% from September 2025 and 7.9% from August. Spartanburg recorded 535, unchanged from a year earlier but down 6.0% from August. Western Upstate recorded 352, down 33.5% year over year and 32.7% month over month.
Western Upstate presents the sharpest contrast between new contracts and completed transactions. Its September closings increased 18.5% from August, even as pending sales declined substantially. These measures describe different stages of the transaction cycle: closings record completed sales, while pending sales record newly accepted offers. A stronger closing month can therefore coexist with a quieter contract pipeline.
Greenville closings were nearly level with August, declining 0.5%, while Spartanburg closings declined 3.5%. Those monthly movements are useful context, but the reports are not seasonally adjusted. September’s changes should not be treated as proof of a lasting direction on their own.
Through September, Greenville closed sales remained 3.6% ahead of the first nine months of 2025. Spartanburg was down 1.8%, and Western Upstate was down 5.6%. Year-to-date pending sales were up 2.9% in Greenville, up 0.1% in Spartanburg and down 5.7% in Western Upstate. The broader picture is therefore one of regional divergence rather than a uniform retreat in demand.
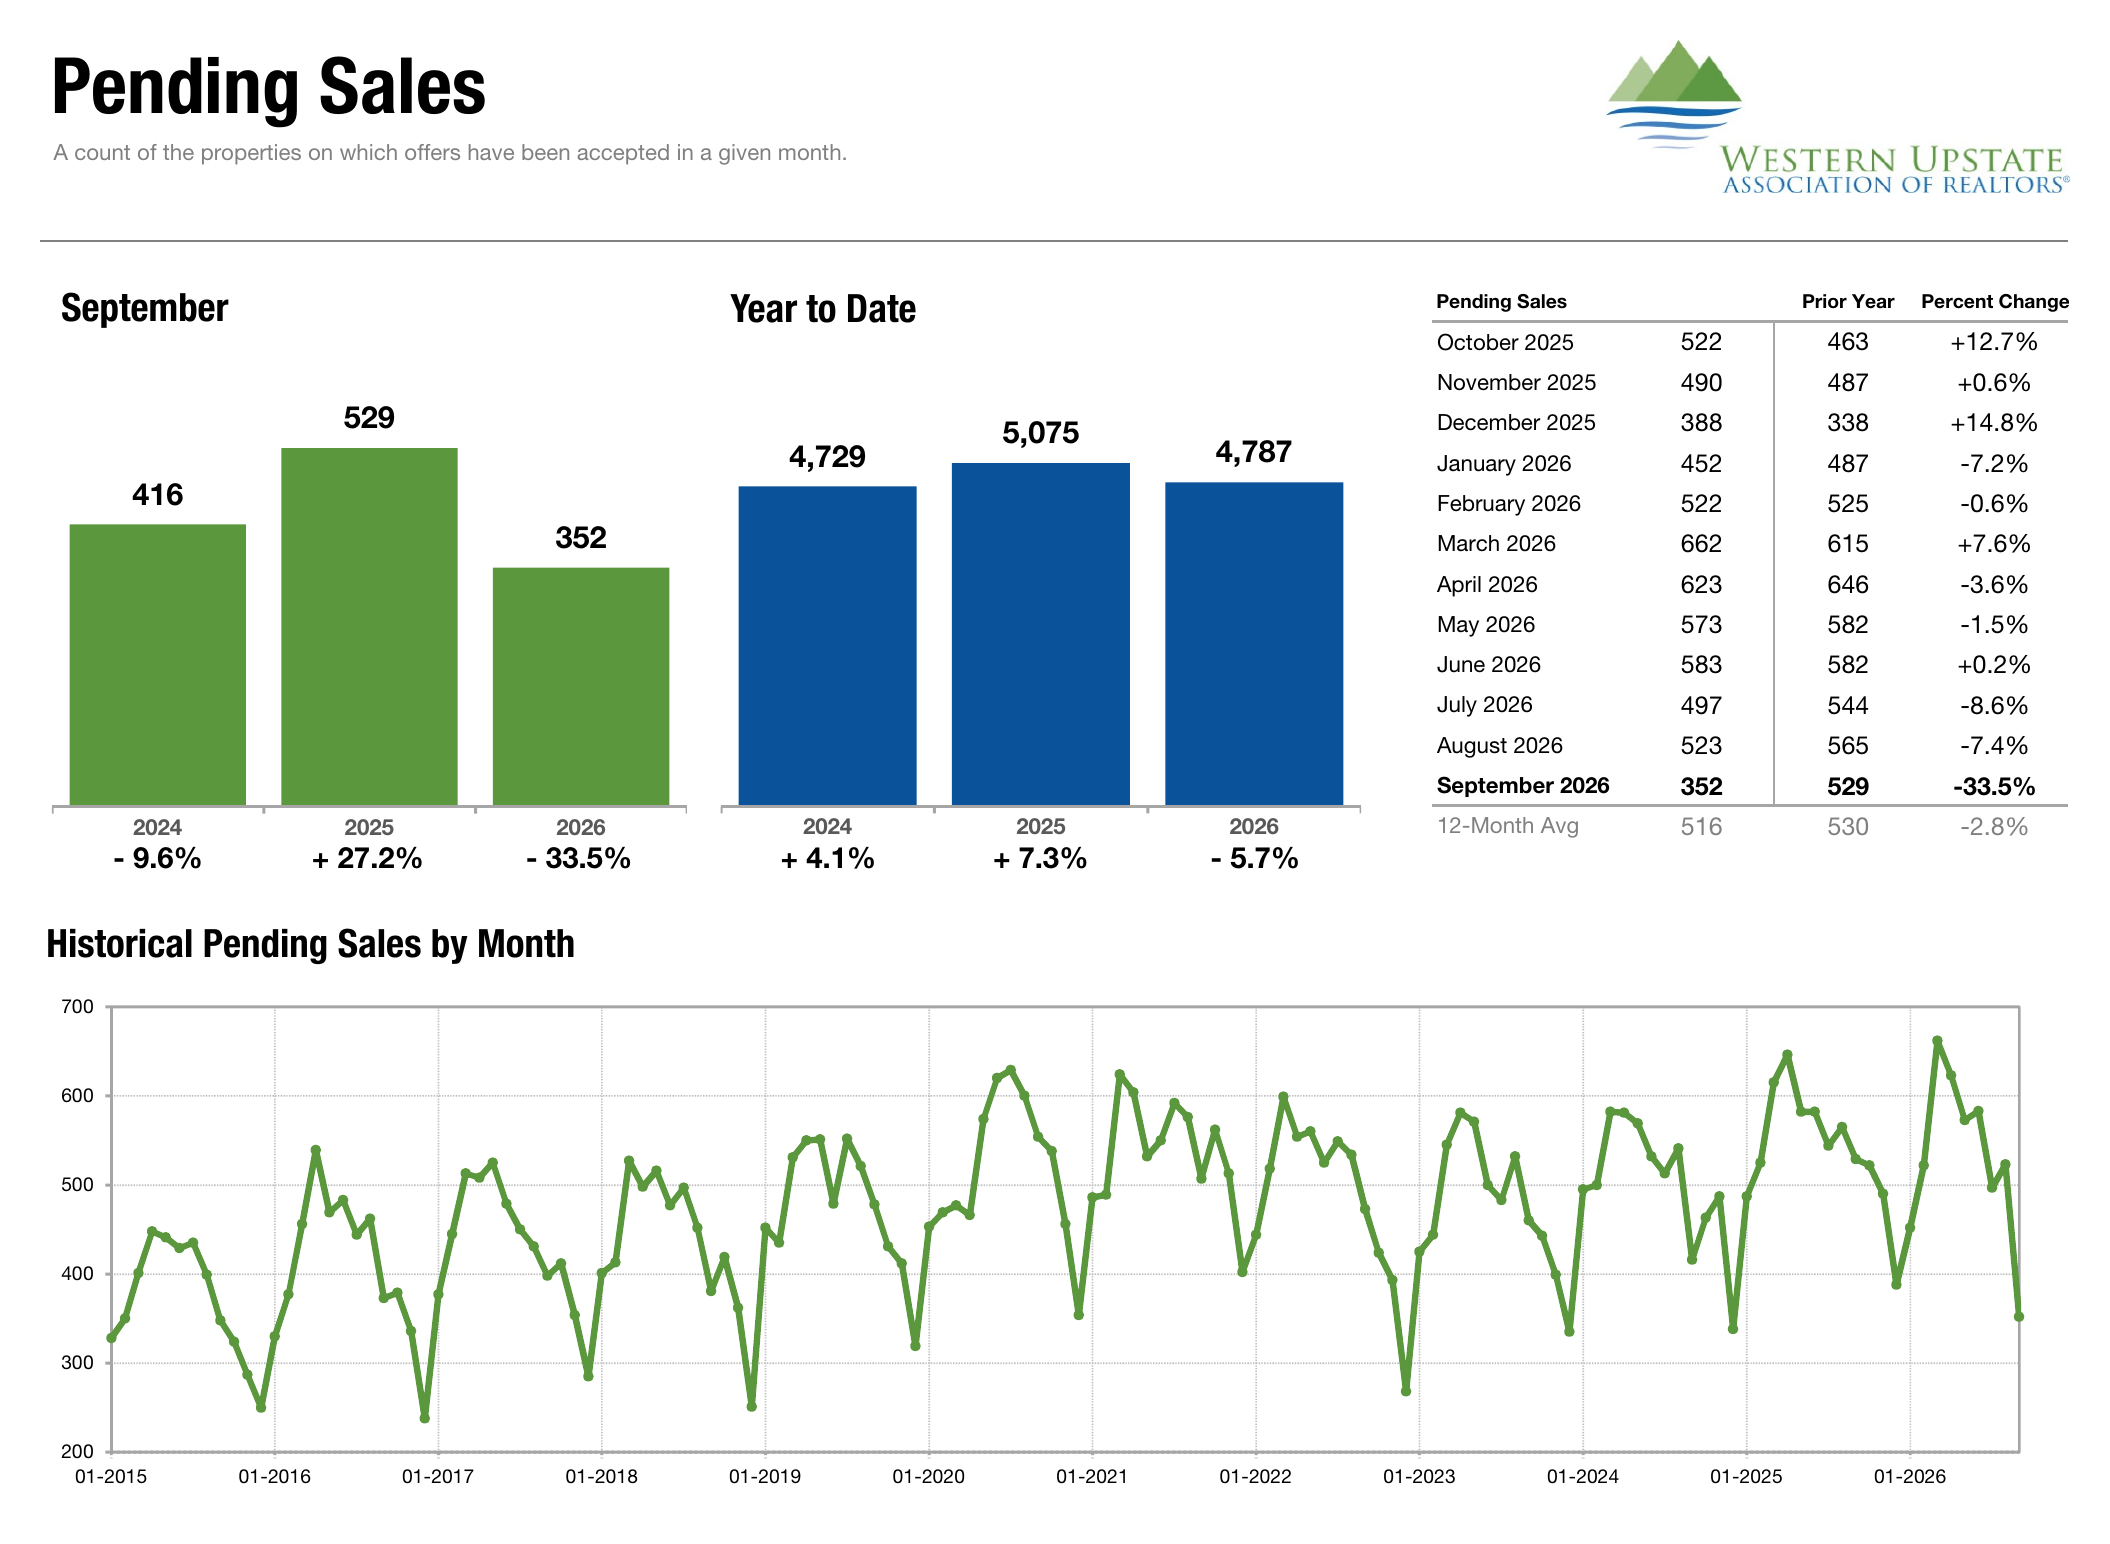
Pending Sales, September 2026, WUMLS
Homes Are Taking Longer to Secure an Offer
Average days on market increased year over year across the Upstate. Greenville averaged 59 days, compared with 54 last September, an increase of 9.3%. Spartanburg averaged 61 days, compared with 48, up 27.1%. Western Upstate averaged 84 days, compared with 72, up 16.7%. The reports define this measure as the average time between listing and an accepted offer.
The monthly direction was less uniform. Greenville increased from 56 days in August to 59 in September, and Western Upstate increased from 78 to 84. Spartanburg improved from 65 to 61 days, a 6.2% decline, even though its marketing time remained well above a year earlier. A monthly improvement and a slower annual pace can both be true.
The rolling 12-month averages reinforce the longer selling horizon. Greenville averaged 58 days, up 11.5% from the preceding 12-month period. Spartanburg averaged 60 days, up 36.4%, while Western Upstate averaged 81 days, up 19.1%. This longer view suggests that September’s elevated marketing times are part of a broader change in pace rather than an isolated monthly reading.
For buyers, a longer decision cycle can allow more time to assess condition, alternatives and relative value. For sellers, it supports a deliberate launch strategy and realistic expectations about timing. It does not mean a well-positioned home cannot attract prompt interest.
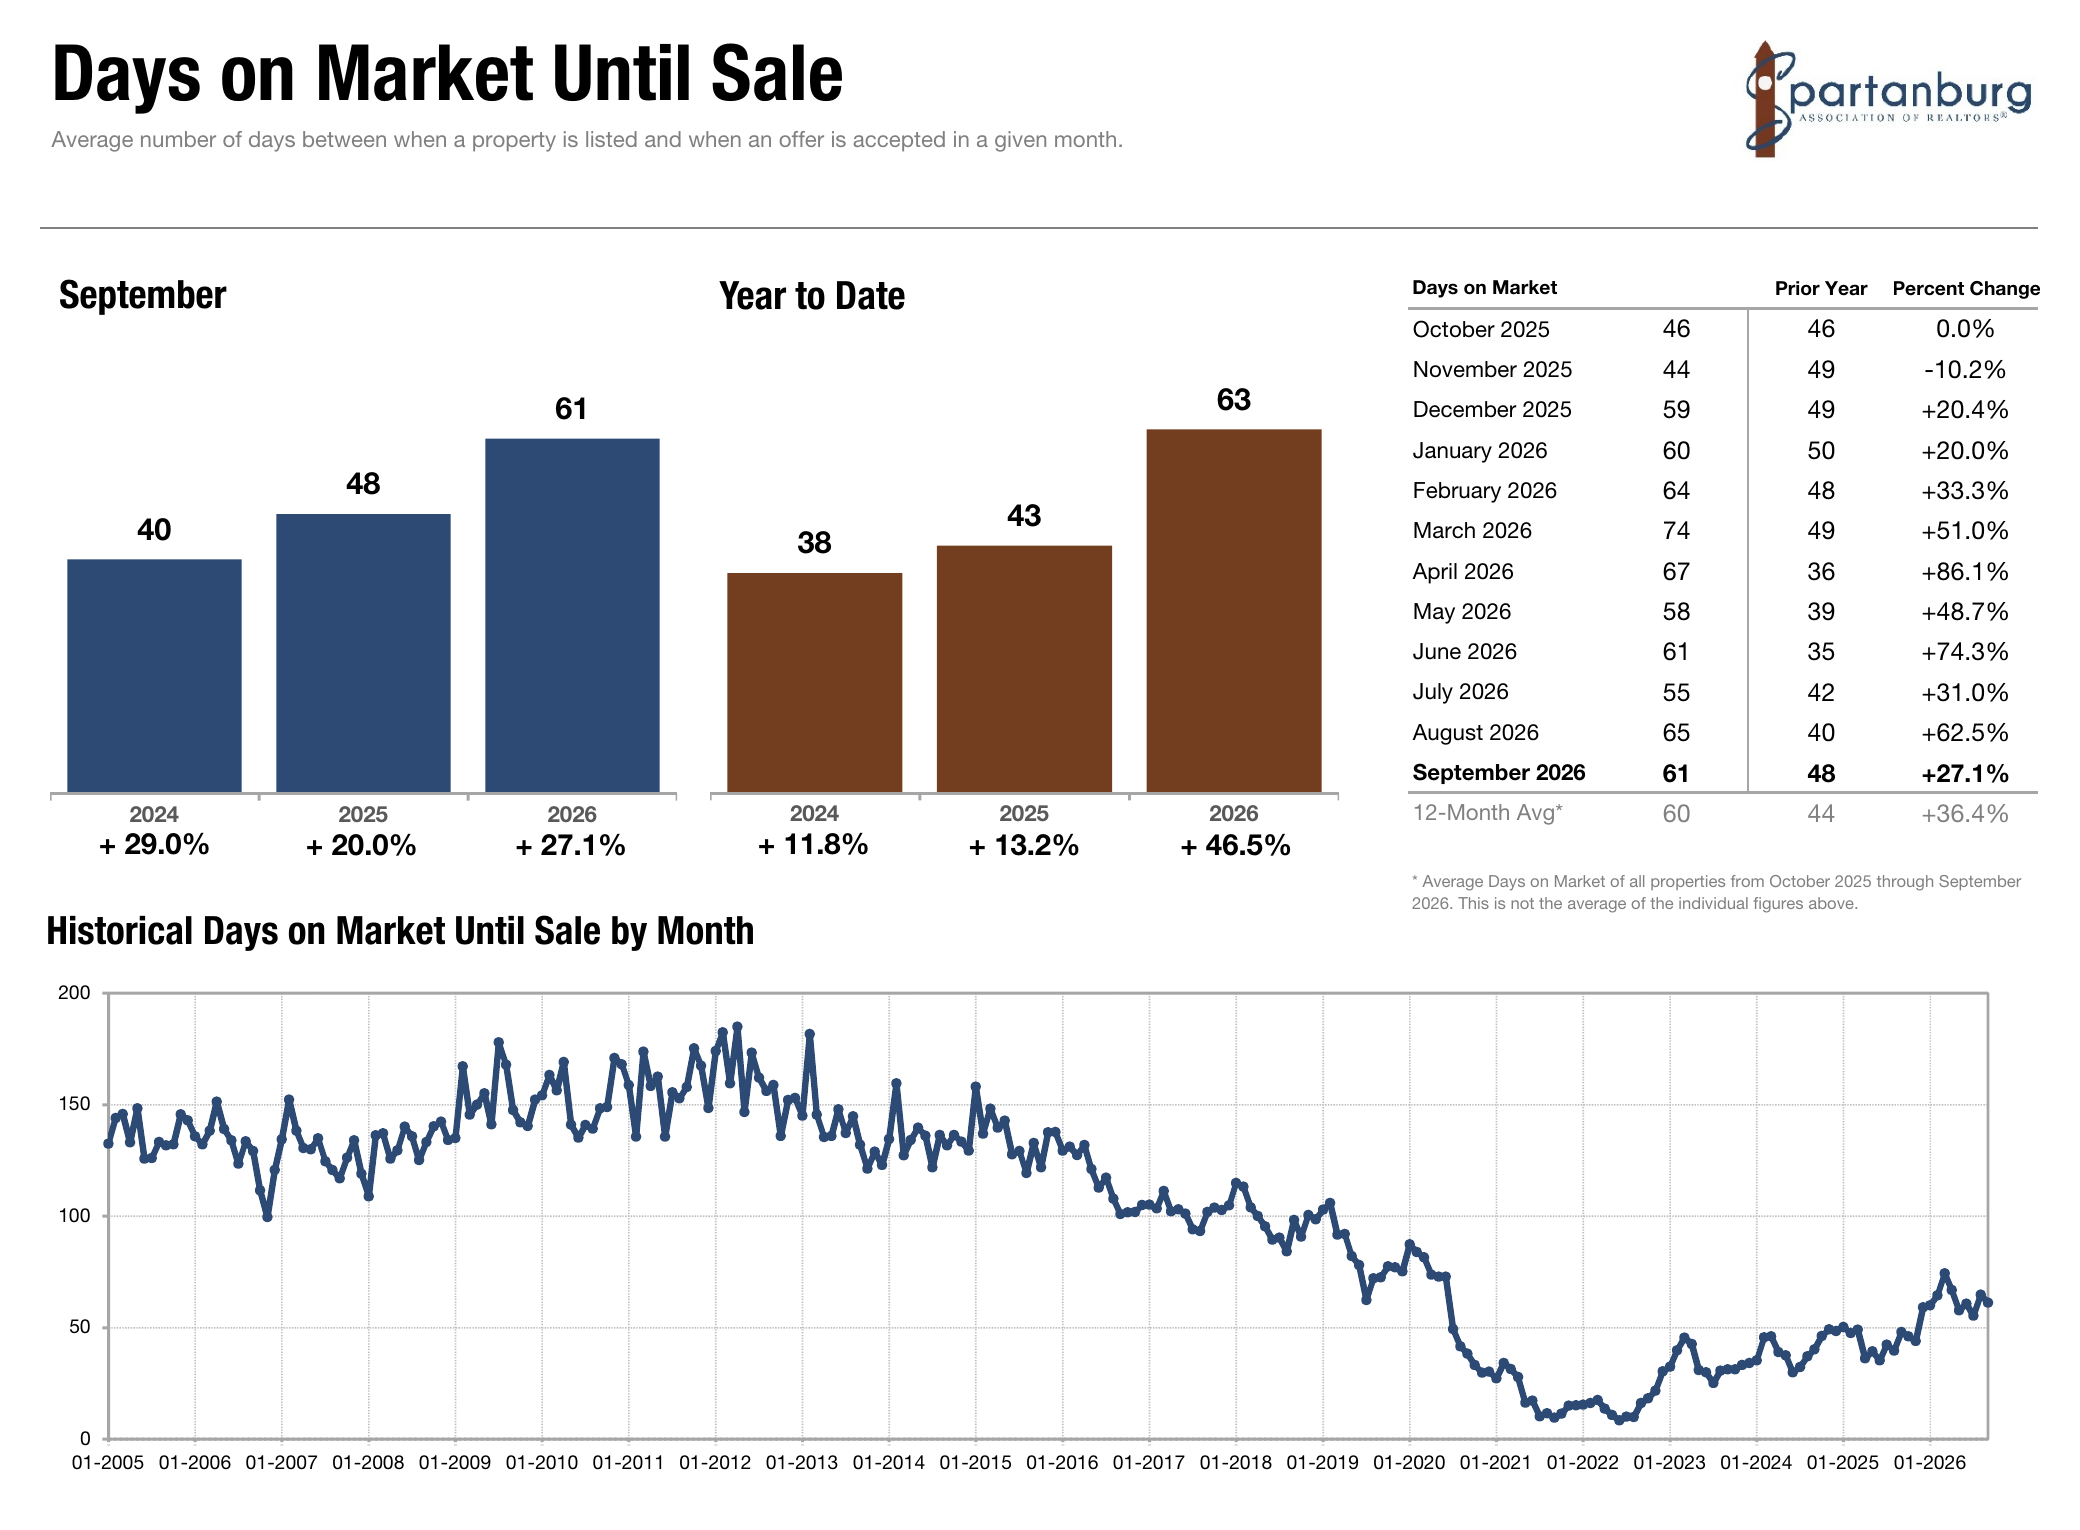
Days on Market Until Sale, September 2026, SAR
Pricing Is Sending Different Signals Across the Region
September median sales prices increased in Greenville and Spartanburg but declined in Western Upstate. Greenville’s median reached $324,900, up 1.5% year over year and 1.5% from August. Spartanburg’s median reached $298,585, up 3.0% annually and 2.4% monthly. Western Upstate’s median declined to $310,000, down 3.1% annually and 0.9% monthly.
Average prices moved differently. Greenville’s average sale price was $413,880, down 2.2% year over year and 0.3% from August. Spartanburg’s average was $331,343, up 4.5% annually and 1.6% monthly. Western Upstate’s average reached $471,773, up 1.2% annually and 11.5% monthly.
Median and average prices describe different aspects of the homes that sold. The median identifies the midpoint of transactions, while the average is more sensitive to high-value sales. Western Upstate’s rising average alongside a declining median illustrates why either measure on its own can give an incomplete impression. The aggregate figures do not establish how much of the change came from transaction mix or changes in individual property values.
The rolling medians are more stable than some monthly movements suggest. Greenville’s 12-month median was $320,000, up 0.3%; Spartanburg’s was $290,000, down 0.2%; and Western Upstate’s was $310,000, unchanged. Those comparisons support a measured description of longer-term pricing rather than a broad claim of rapid appreciation or widespread price declines.
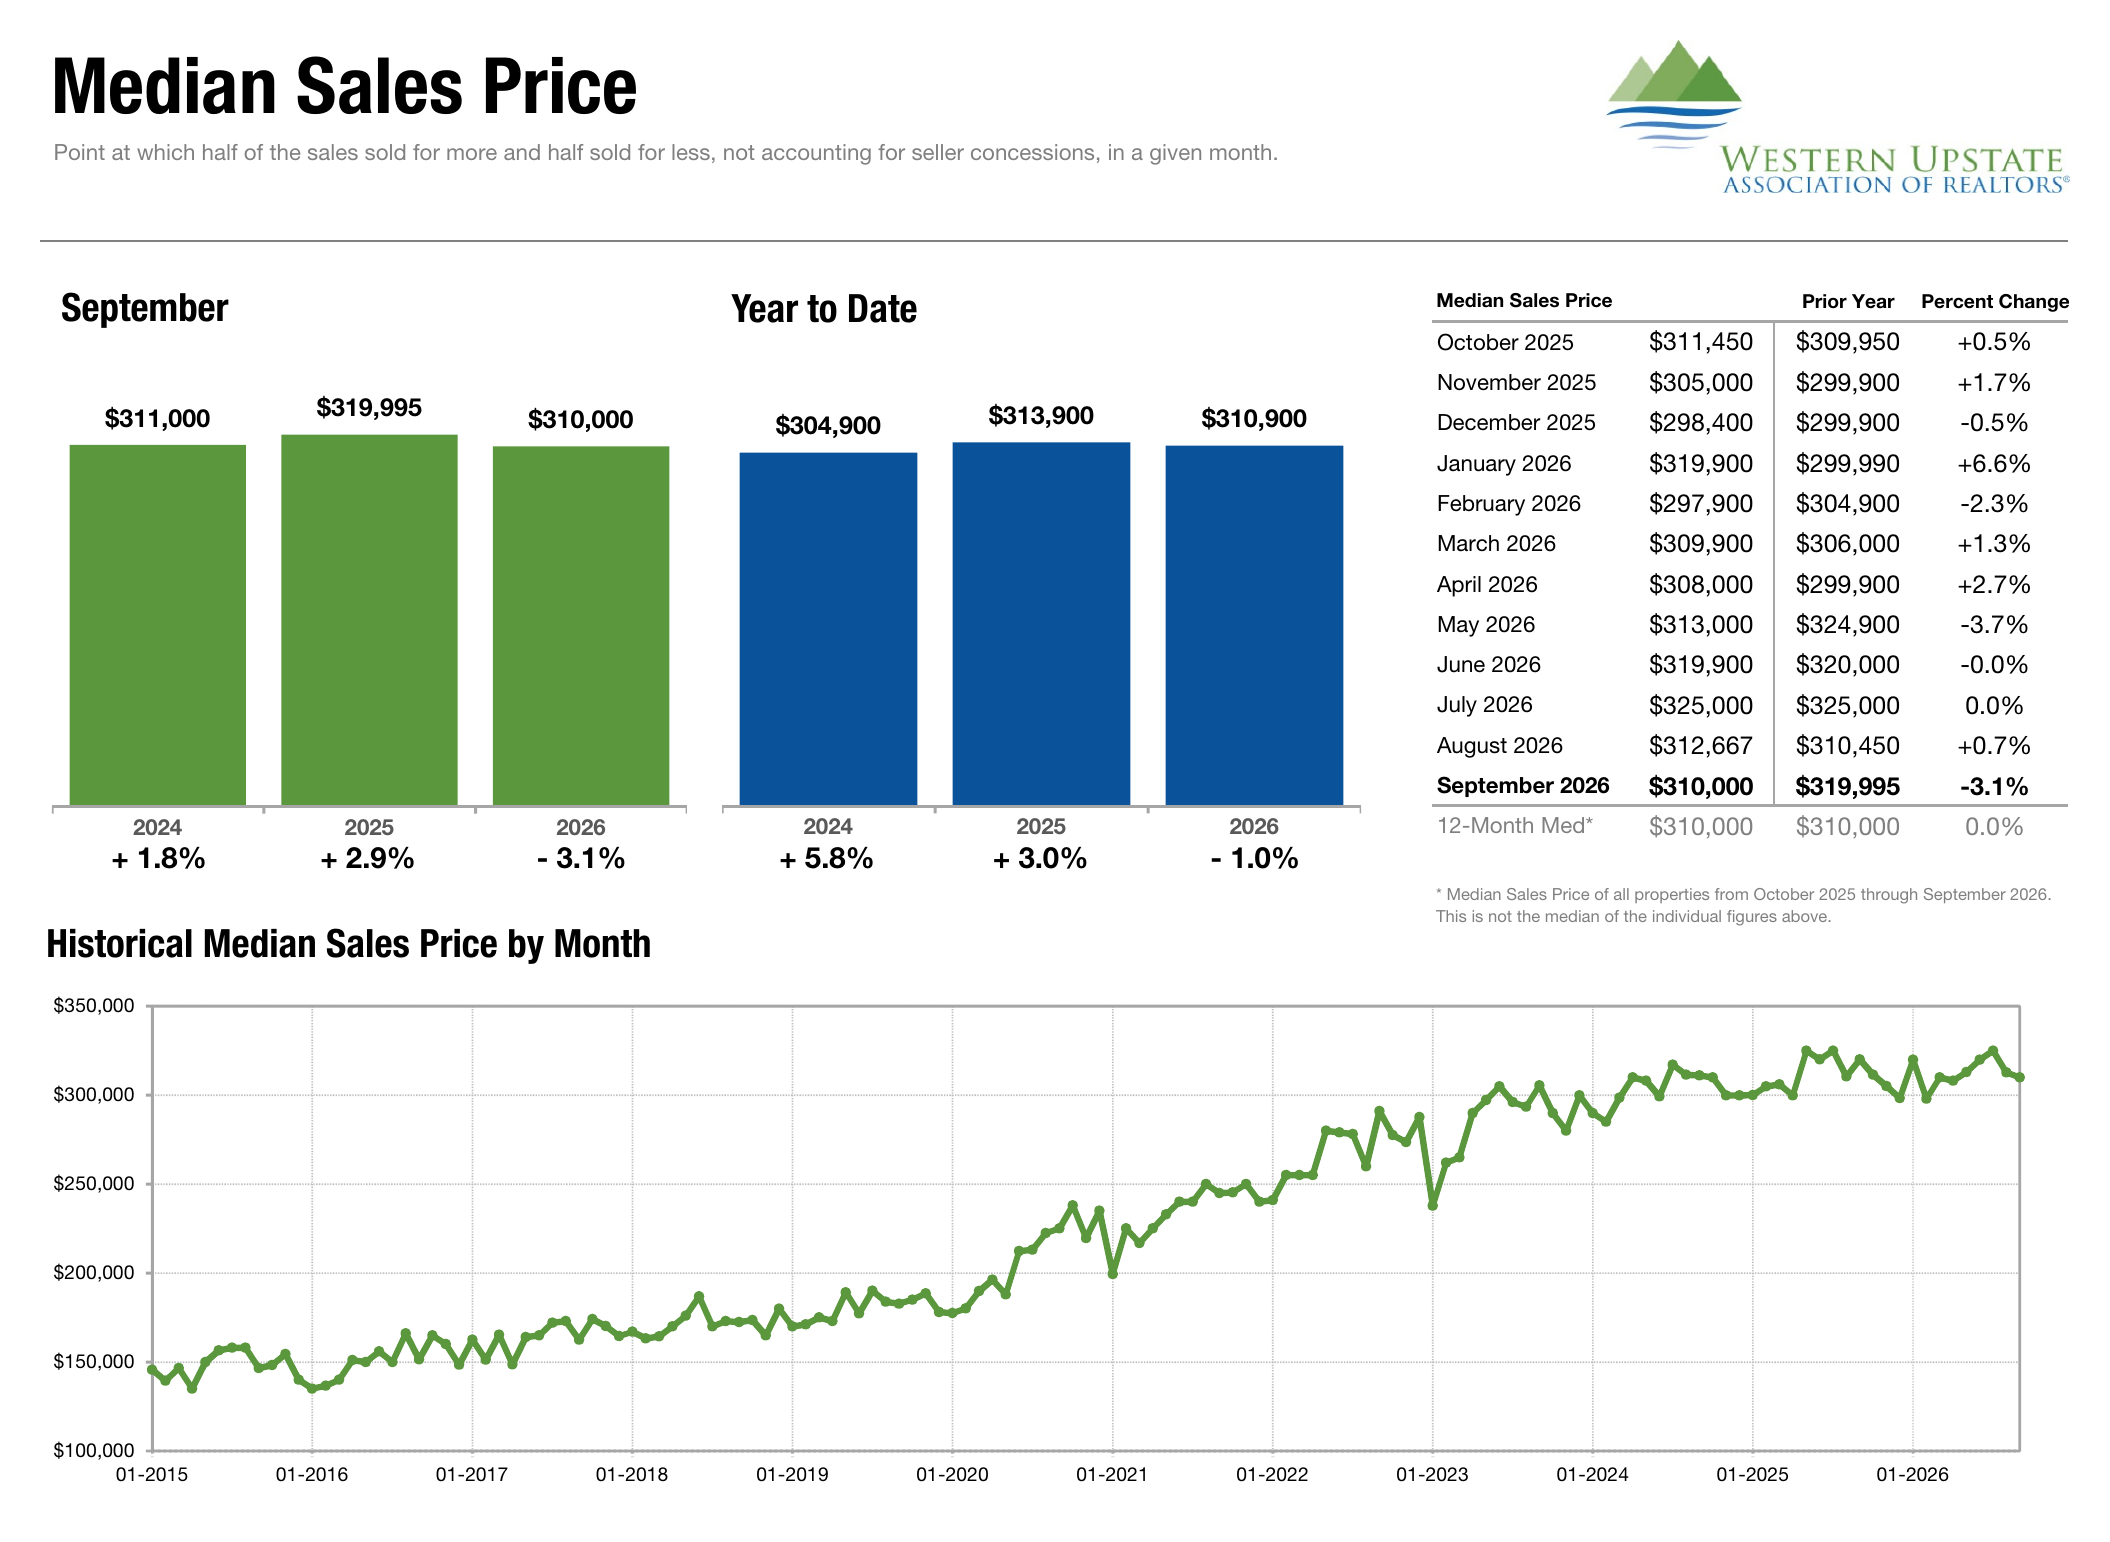
Median Sales Price, September 2026, WUMLS
Greater Greenville Shows Strength at Higher Price Points, Alongside More Supply
Greenville’s rolling price-range data shows that activity above $1 million has expanded. Over the 12 months ending September, pending sales in the $1,000,001-and-above range increased 21.1%, from 568 to 688. Closed sales increased 14.5%, from 560 to 641. The $500,001-$750,000 range also recorded growth, with pending sales up 8.6% and closings up 12.6%.
That stronger activity has not prevented available supply from growing. September inventory above $1 million increased 31.8% to 489 homes, while months supply increased from 7.8 to 8.5. The upper tier is generating transactions, but buyers also have a larger selection to consider.
The $250,001-$350,000 range offers a different balance. Rolling closings increased 5.5% to 6,666, while active inventory declined 2.9% to 2,059 and supply stood at 3.7 months. That contrast demonstrates why the region’s overall inventory growth does not describe every price range equally.
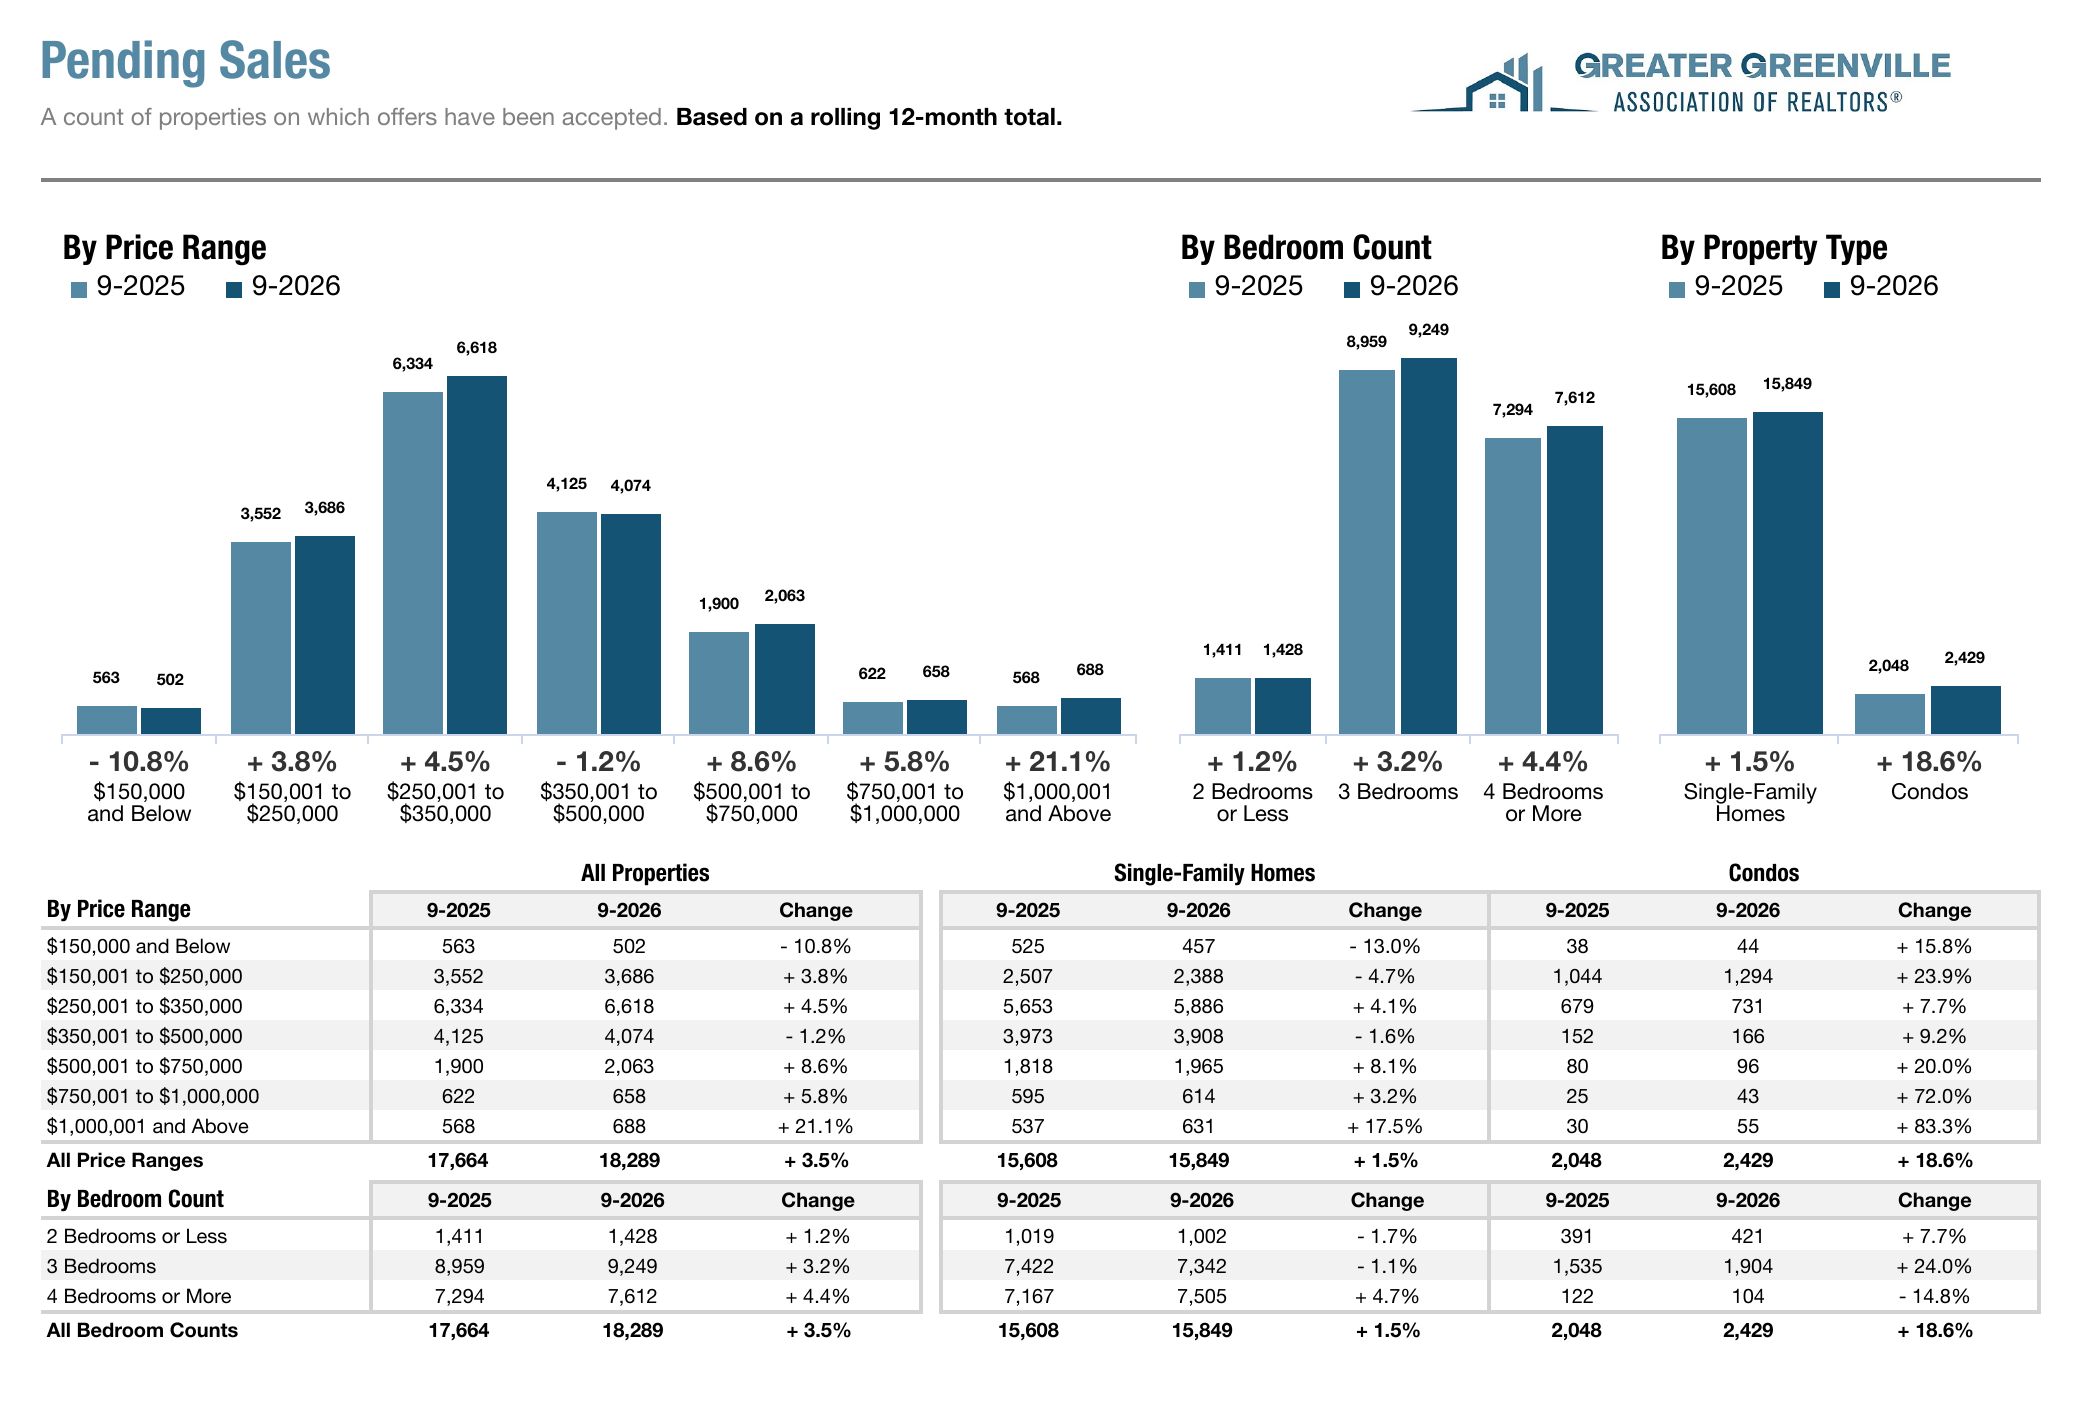
Pending Sales by Price Range, September 2026, GGAR
Spartanburg and Western Upstate Add Important Nuance to the Upper-Tier Story
Spartanburg also recorded growth above $1 million, but from a considerably smaller base. Rolling pending sales increased 26.3%, from 38 to 48, and closings increased 14.3%, from 35 to 40. Those absolute counts matter: a small increase in transactions can produce a substantial percentage change. Supply above $1 million remained elevated at 16.3 months, although it was lower than the 18.3 months reported a year earlier.
The strongest percentage growth in Spartanburg rolling closings occurred in the $750,001-$1 million range, up 16.3%, while the $500,001-$750,000 range increased 11.9%. In contrast, closings at $250,001-$350,000 declined 2.4%, and those at $350,001-$500,000 declined 3.3%. Growth was selective rather than broad-based.
Western Upstate’s upper tier presents another variation. Rolling closings above $1 million increased 10.3%, from 281 to 310, but pending sales edged down 0.7%, from 303 to 301. Inventory increased 63.4% to 281 homes, and supply rose from 6.8 to 11.2 months. Average rolling marketing time in that bracket increased from 92 to 100 days.
Elsewhere in Western Upstate, rolling closings increased 10.7% at $750,001-$1 million but declined 10.1% at $500,001-$750,000. The core $250,001-$350,000 bracket recorded a 2.5% increase in closings and carried 4.4 months of supply. The evidence supports discussing individual price bands rather than treating the upper half of the market as one continuous trend.
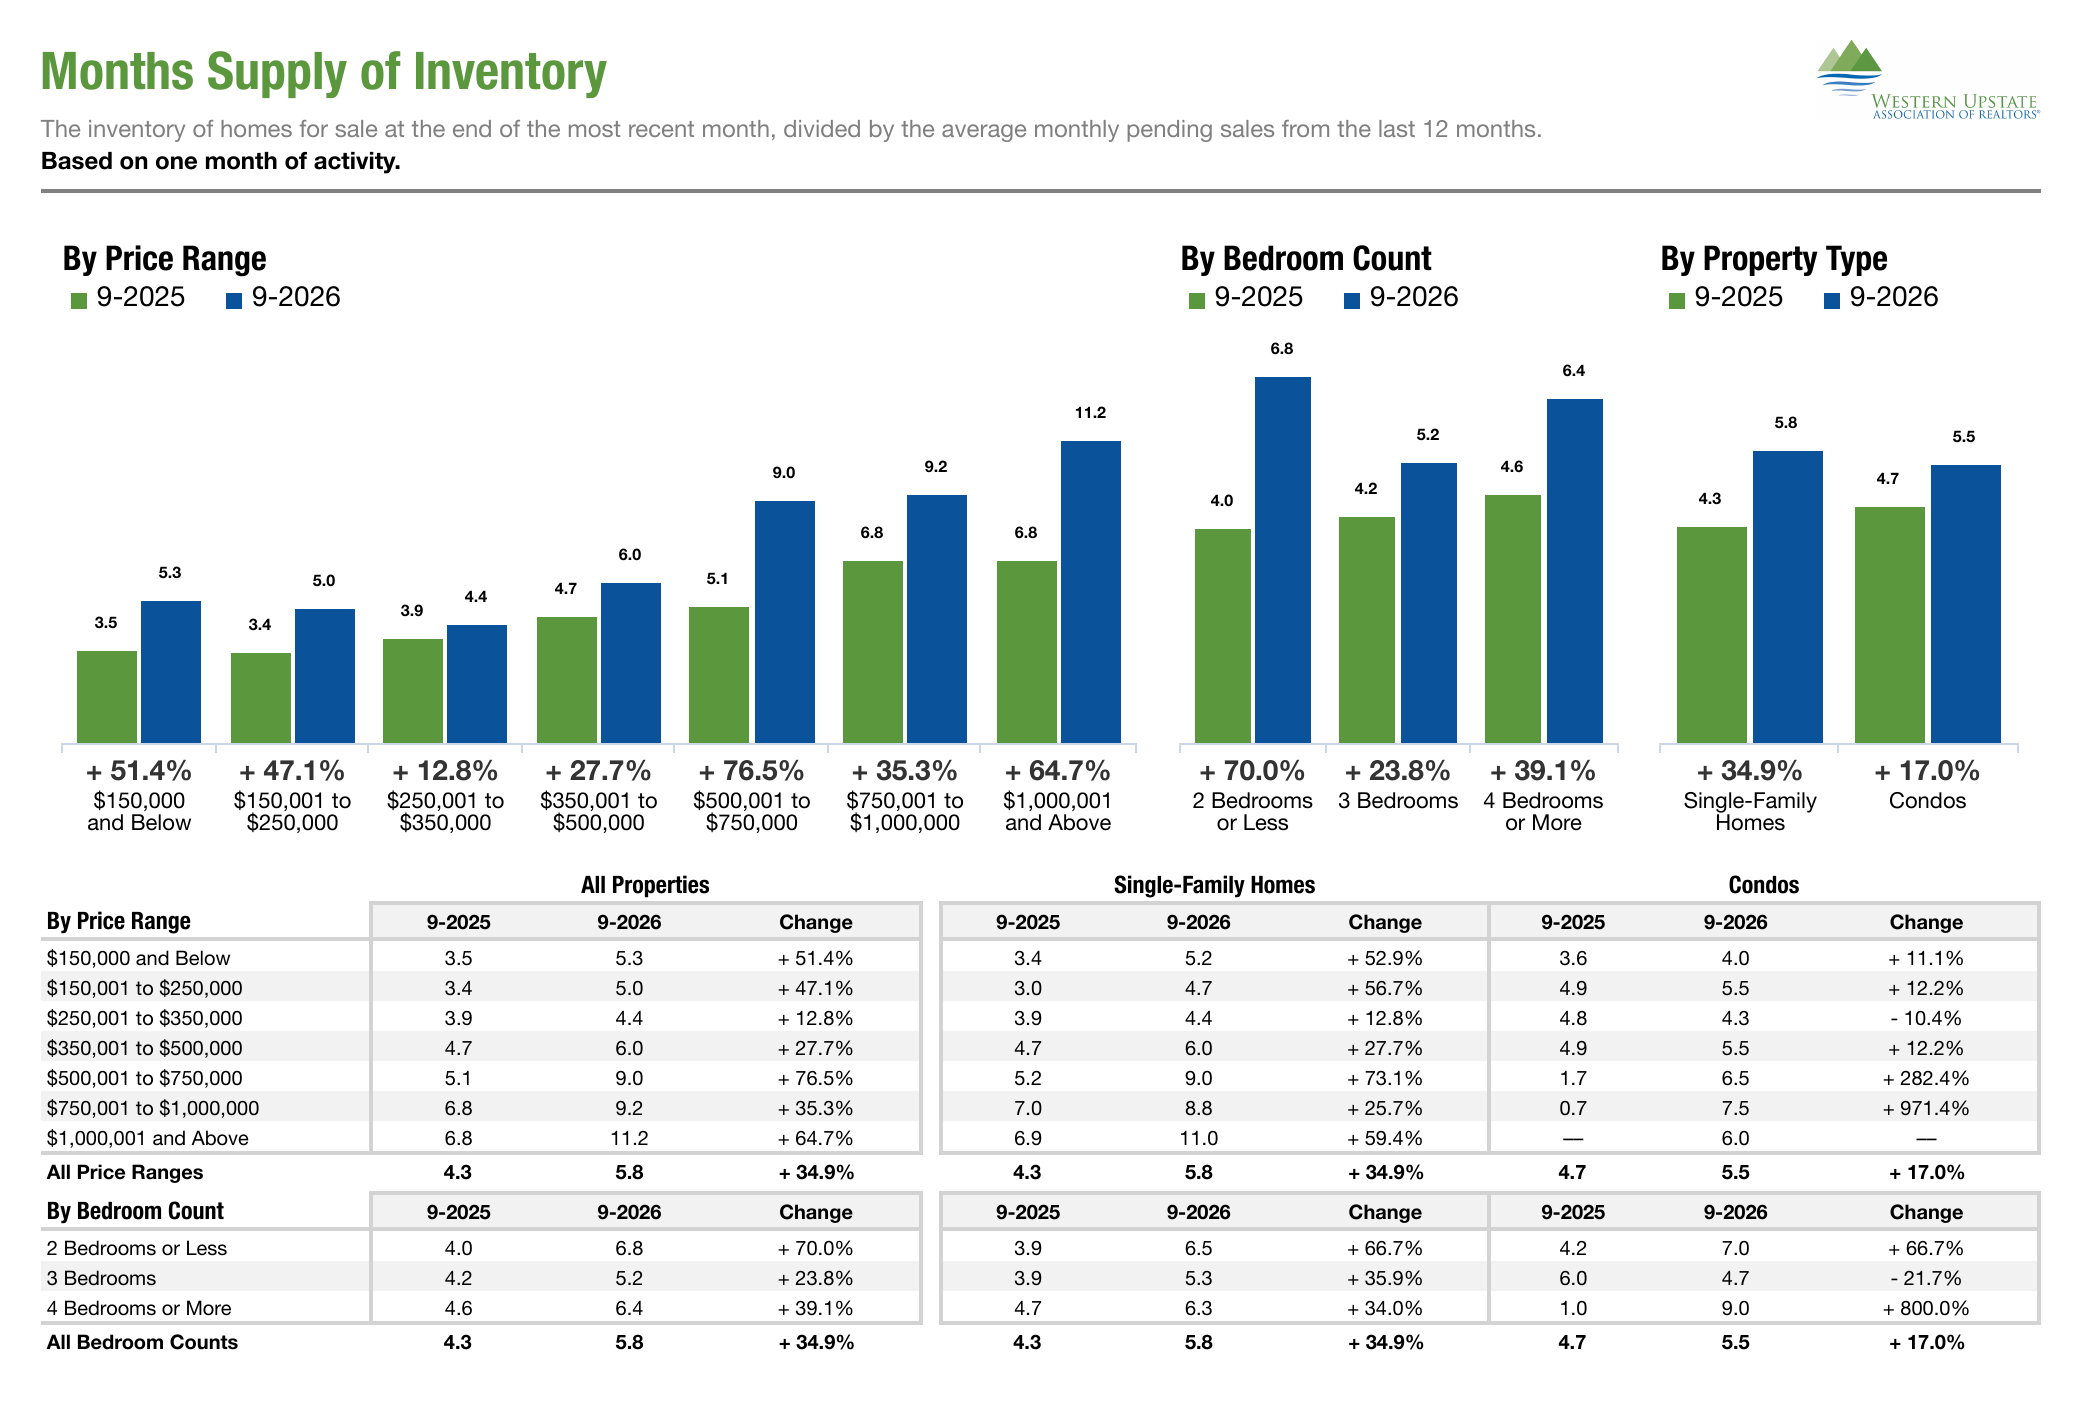
Months Supply of Inventory, September 2026, WUMLS
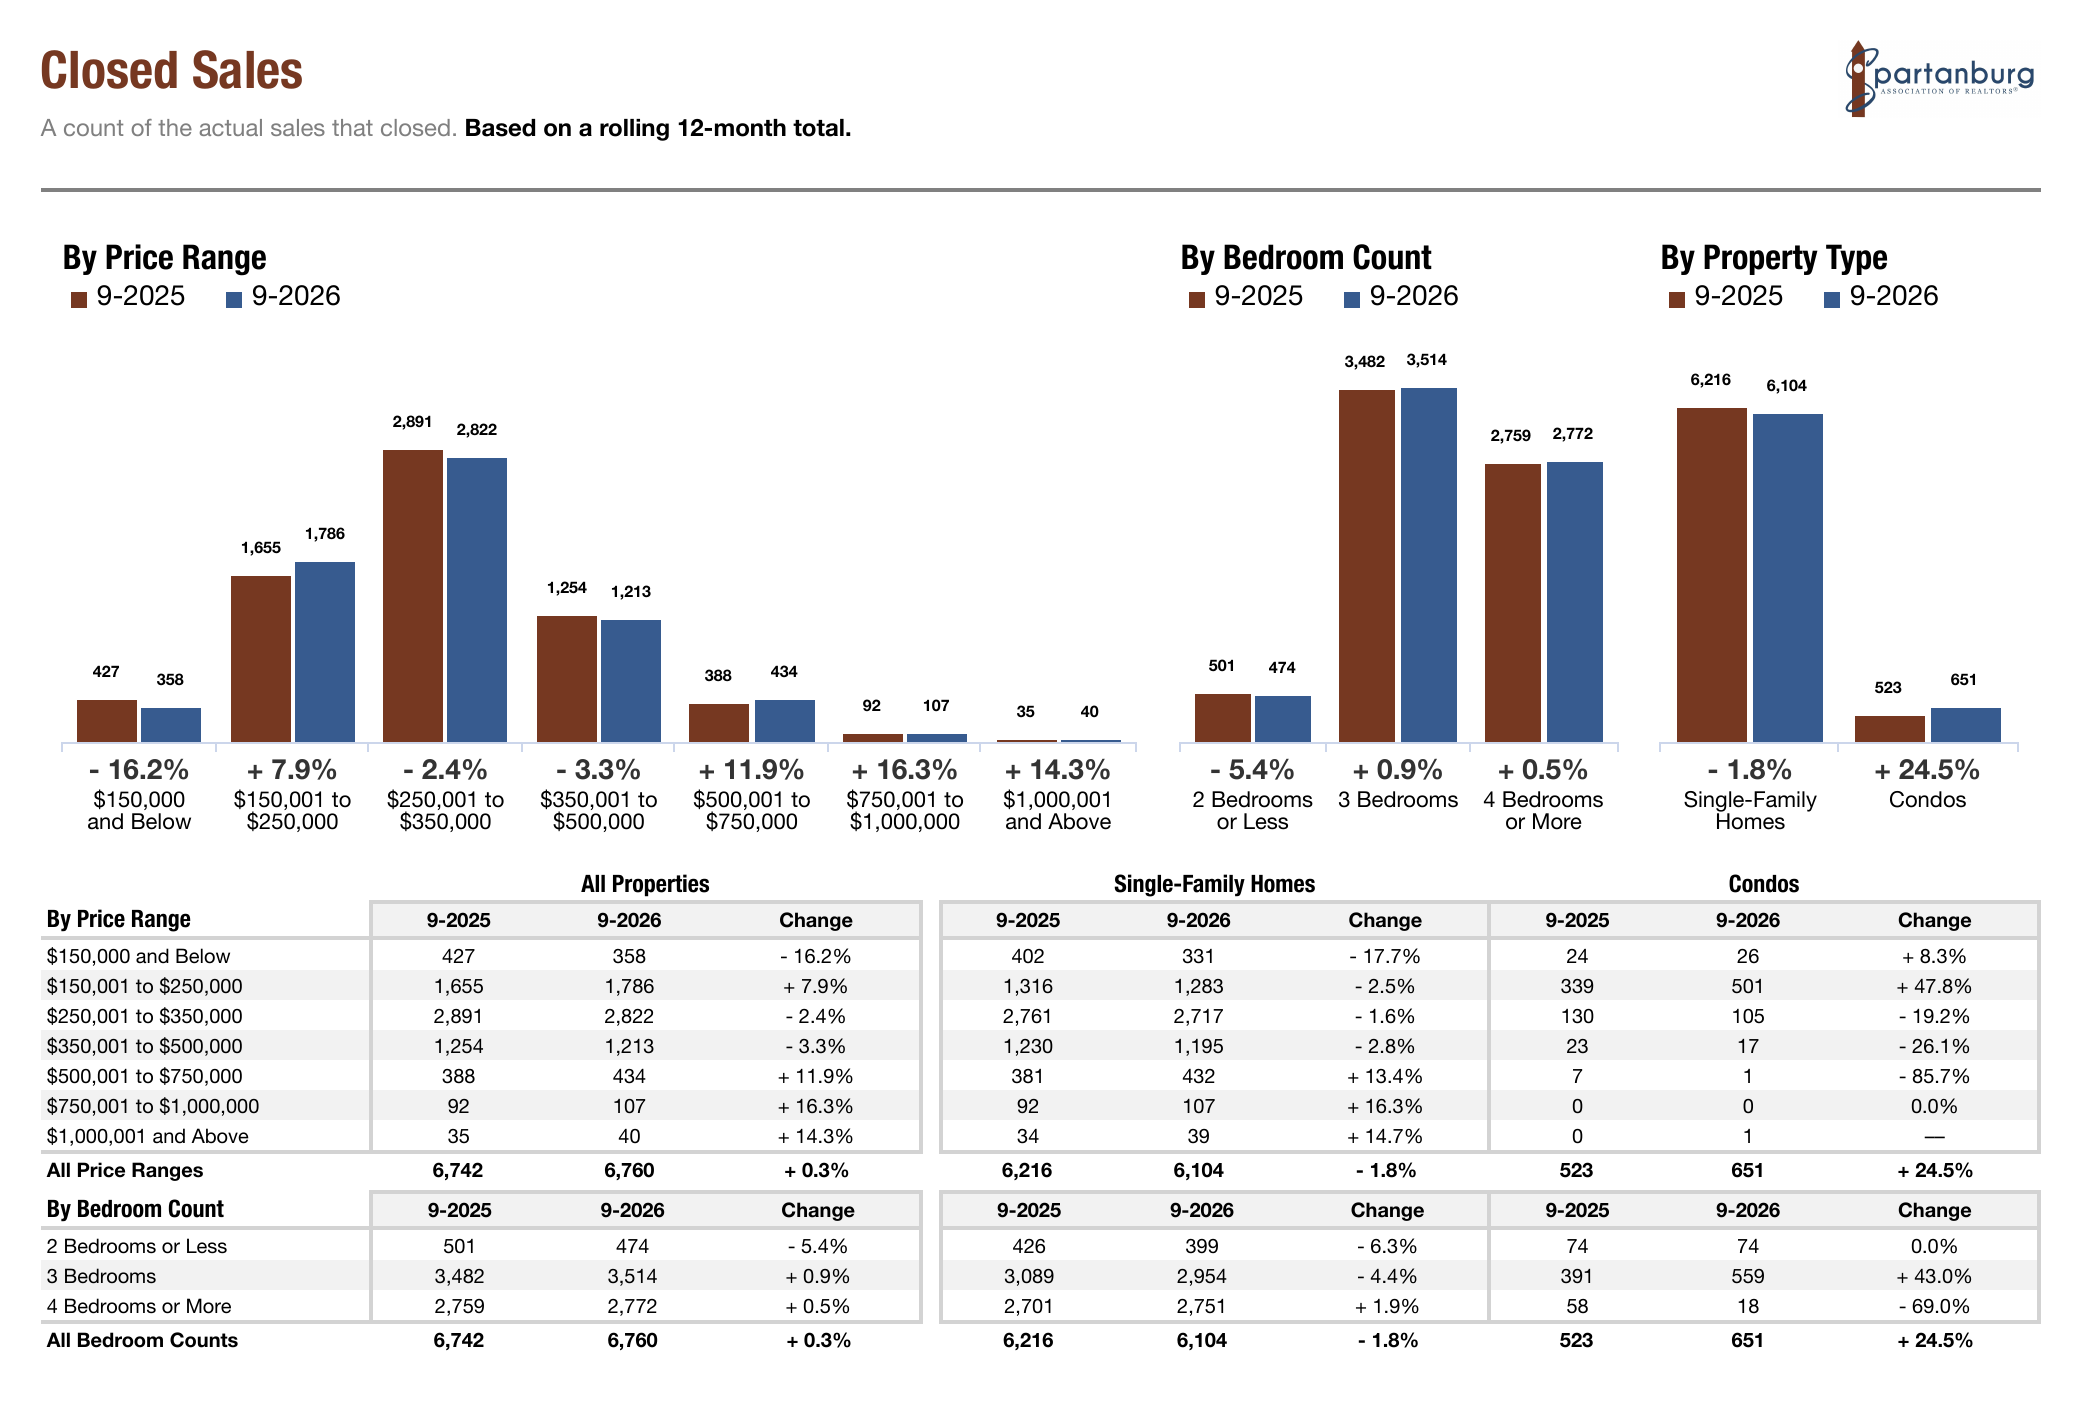
Closed Sales by Price Range, September 2026, SAR
What This Means for Buyers and Sellers
For buyers, September provides a broader field of possibilities than a year earlier. Longer marketing times and more available homes can create space for careful comparison, particularly in price ranges with substantial supply. The opportunity is to understand the alternatives surrounding a specific property rather than assume that a regional headline determines the terms of every transaction.
For sellers, the most useful response is a clear position within the current competitive set. Recent relevant sales, active alternatives, property condition and the pace of the appropriate price range should inform expectations. Higher sale prices in one market or stronger rolling activity in an upper tier do not remove the need for careful pricing and presentation.
For both sides, the regional reports provide context. A specific neighborhood, property type or price point may behave differently from the overall MLS territory. The detail surrounding the home remains central to the decision.
Looking Ahead
September’s Upstate market is more selective, with differences that matter. All three regions have more inventory and longer marketing times than a year ago, but Greenville remains ahead in year-to-date closings, Spartanburg combines higher September prices with softer completed activity, and Western Upstate pairs a monthly closing rebound with a pronounced reduction in new contracts.
The next reports will help clarify whether September’s weaker pending activity persists, whether available inventory continues to expand in Spartanburg and Western Upstate, and how those relationships affect the pace of completed sales. In the upper tiers, the balance between transaction growth and competing supply will remain particularly useful to watch.
Those relationships offer a more meaningful guide to the market than any one month’s change in price. A considered approach begins with the wider picture and becomes most useful when applied to the property and the goals of the move.
Data Sources & Methodology
Sources: September 2026 reports provided by South Carolina REALTORS, using Greater Greenville (GGAR), Spartanburg (SAR) and Western Upstate (WUMLS) MLS data; produced by ShowingTime Plus. Current as of October 10, 2026.
Year-over-year comparisons refer to September 2026 versus September 2025 unless otherwise stated. Month-over-month changes are calculated as (September / August - 1) x 100, rounded to one decimal, using August values in the September reports to preserve a consistent publication vintage. Monthly figures are not seasonally adjusted. Year-to-date comparisons cover January through September. Rolling comparisons cover October 2025-September 2026 versus October 2024-September 2025. Inventory represents active homes at month-end. Months supply divides month-end inventory by average monthly pending sales over the preceding 12 months. Average days on market measures listing to accepted offer as defined in the reports. Median and average sales prices exclude seller concessions and are not same-property appreciation measures. Regional MLS territories can overlap and have not been added together. Statewide reports were supplied as background; the analysis uses the six regional reports listed above.
More from Blackstream